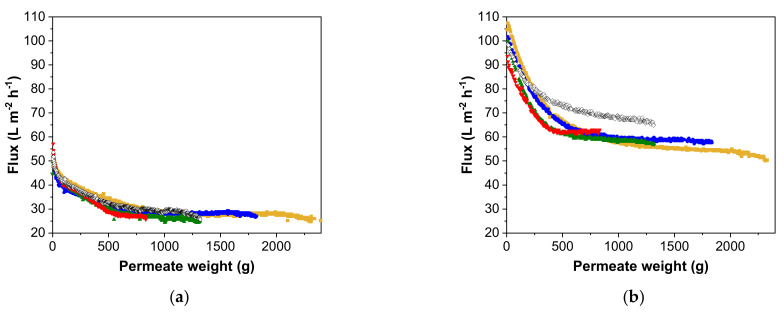
Figure 3.
Flux decline in relation to different pre-concentration factors for MV in (a) SCM and (b) SFM. For continuous diafiltration, the data represent pre-concentration factors of 1 (yellow), 1.33 (blue), 2 (green) and 4 (red). For discontinuous diafiltration, the pre-concentration factor of 2 is represented by open diamonds [37].

