
Figure 1: Chronic Intracranial BNST Recordings Demonstrate Gamma Correlates with Depression Symptoms.
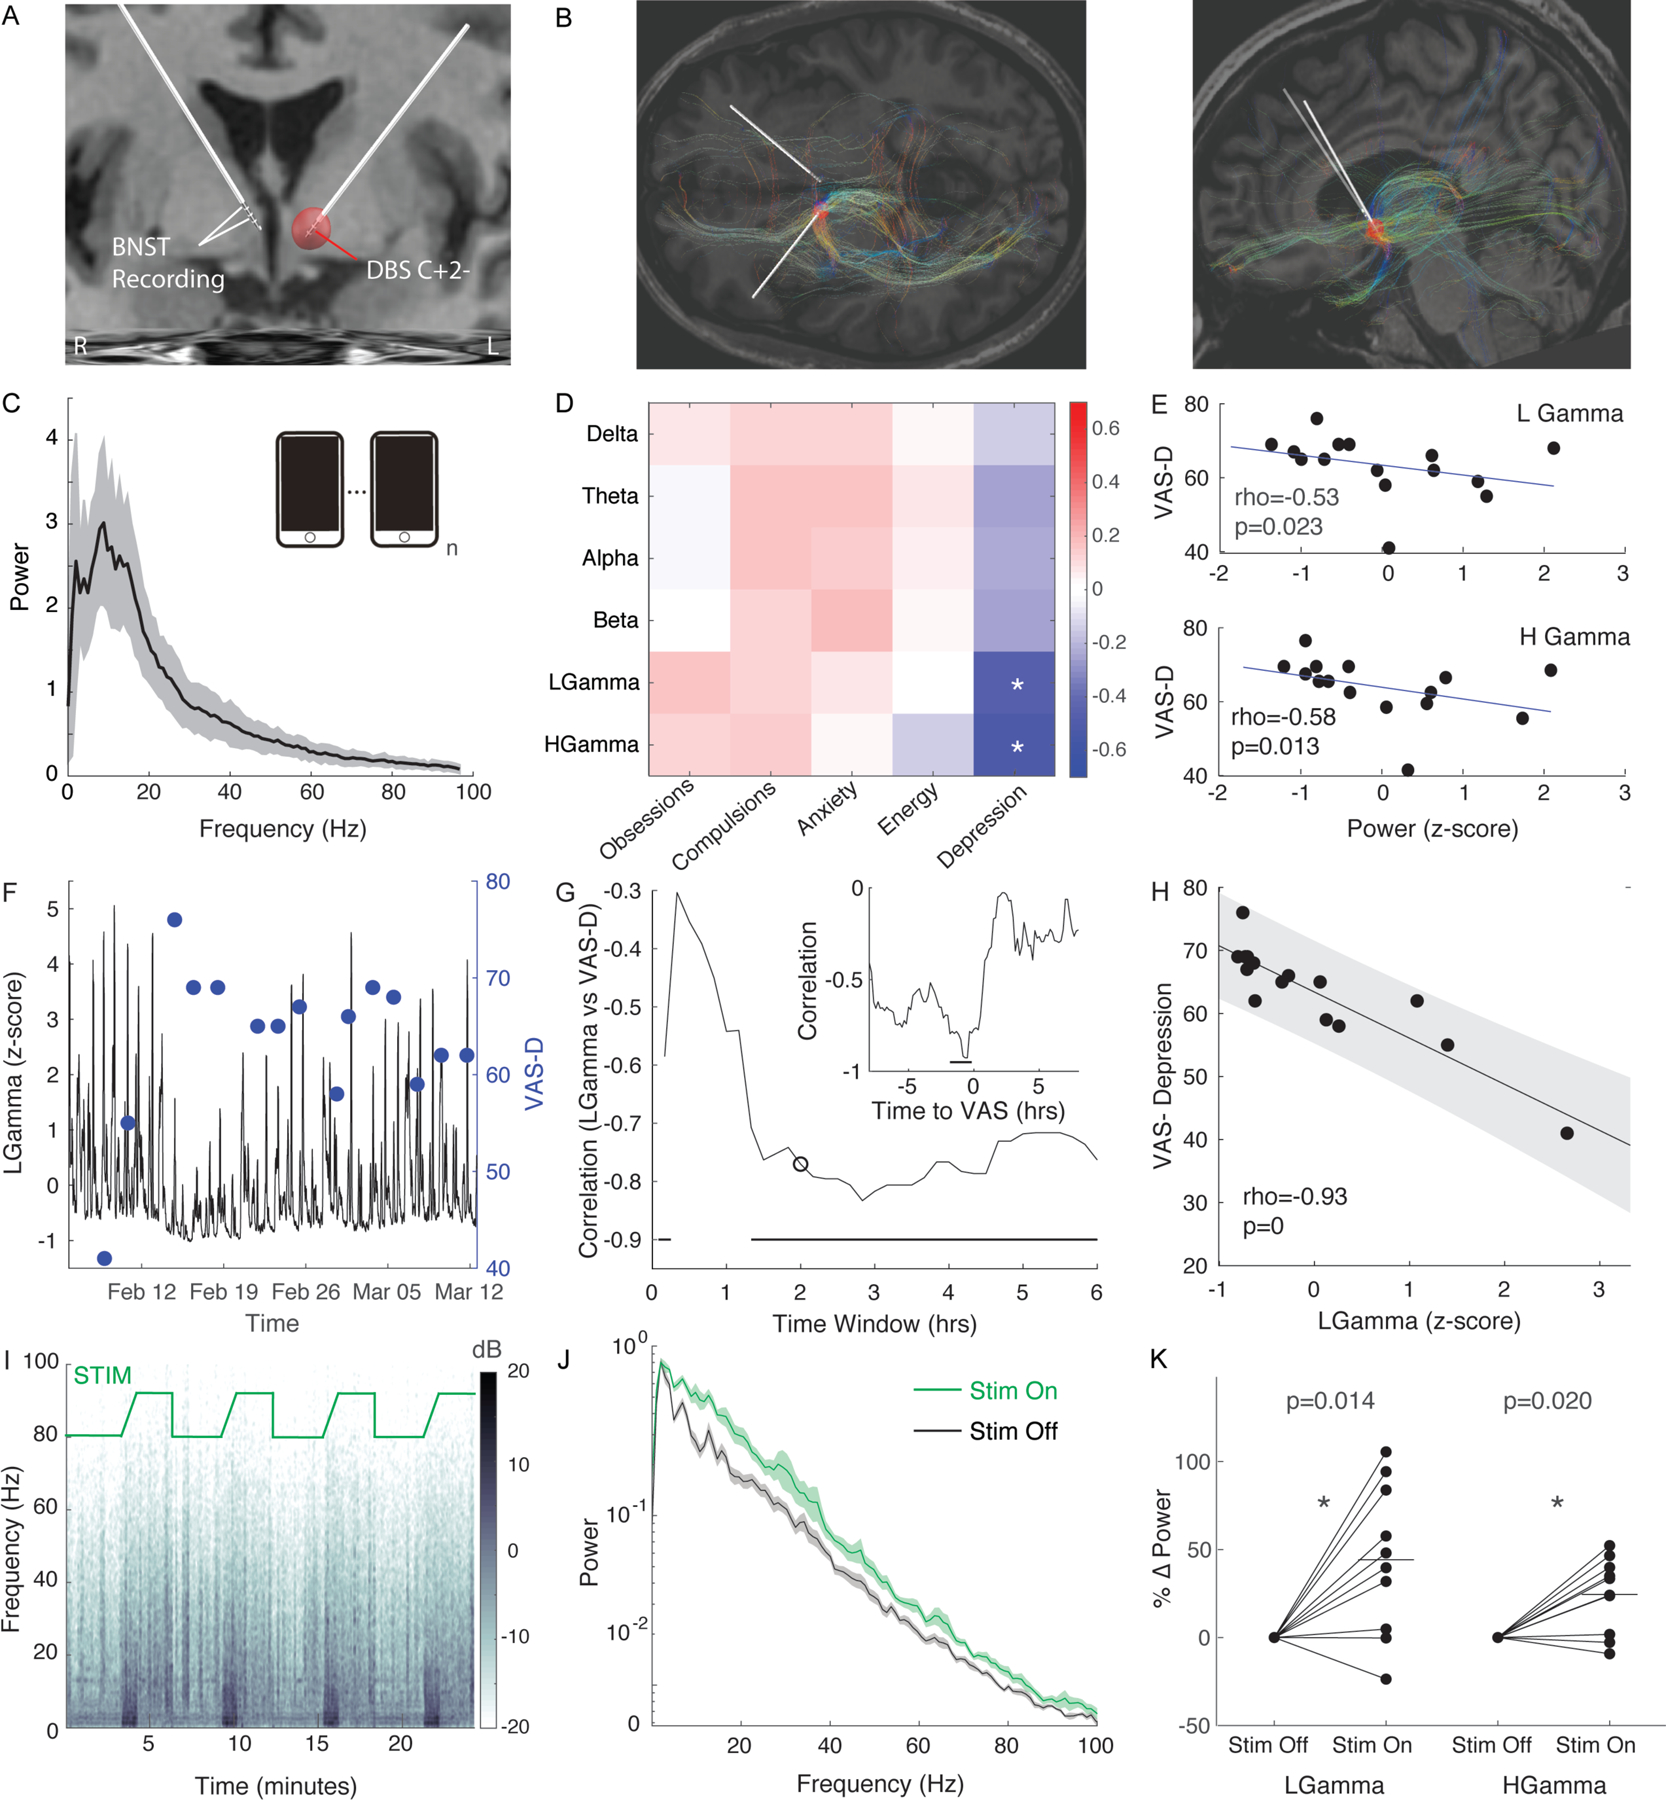
A) Coronal MRI with reconstruction of DBS quadripolar electrode placement. Active monopolar contact is contact 2 on left lead. Recording in bipolar configuration on right lead contacts 3 and 1. Red sphere represents estimated volume of tissue activation.
B) Fiber tracts from estimated volume of tissue activation based upon diffusion tensor imaging (DTI) in the horizontal (left panel) and sagittal (right panel) plane
C) Average power spectra of 15 patient triggered events. Shaded region represents S.E.M.
D) Spearman correlation coefficients of power bands vs visual analogue scales (VAS) of symptoms.
E) Plot of power for low gamma (25–50Hz) (top panel) and high gamma (50–100Hz) (bottom panel) vs VAS-Depression. Rho represents Spearman correlation. P-values derived from permutation test.
F) Sliding average of low gamma (25±2.5Hz) (black) activity averaged over 2hr bins and VAS-Depression self-reports across time
G) Spearman correlation of low gamma (25±2.5Hz) vs VAS-Depression binned across various size time windows. Circle demarcates correlation for 2hr time window. Line indicates time windows in which correlation is significant based upon Bonferroni corrected permutation test. Inset demonstrates Spearman correlation of low gamma vs VAS-D for various times relative to VAS surveys. Dark line represents time lags in which correlation was significant based upon a bootstrap test.
H) Plot of low gamma (25±2.5Hz) power within a 2hr window ending 30min prior to survey vs self-reported VAS-Depression. Line represents linear fit and shaded region represents 95% confidence interval. P-value represents results of permutation test.
I) Spectrogram while stimulation cycles from Off (3 min) to On (3min). There is a ramp in stimulation amplitude at the onset of the stimulation trial.
J) Power spectra during rest period when stimulation is On (green) and Off (black). Shaded region represents S.E.M.
K) Percent change in power from stimulation Off to On. Line represent average percent change with stimulation On. * indicates p<0.05 based upon a sign-rank test.