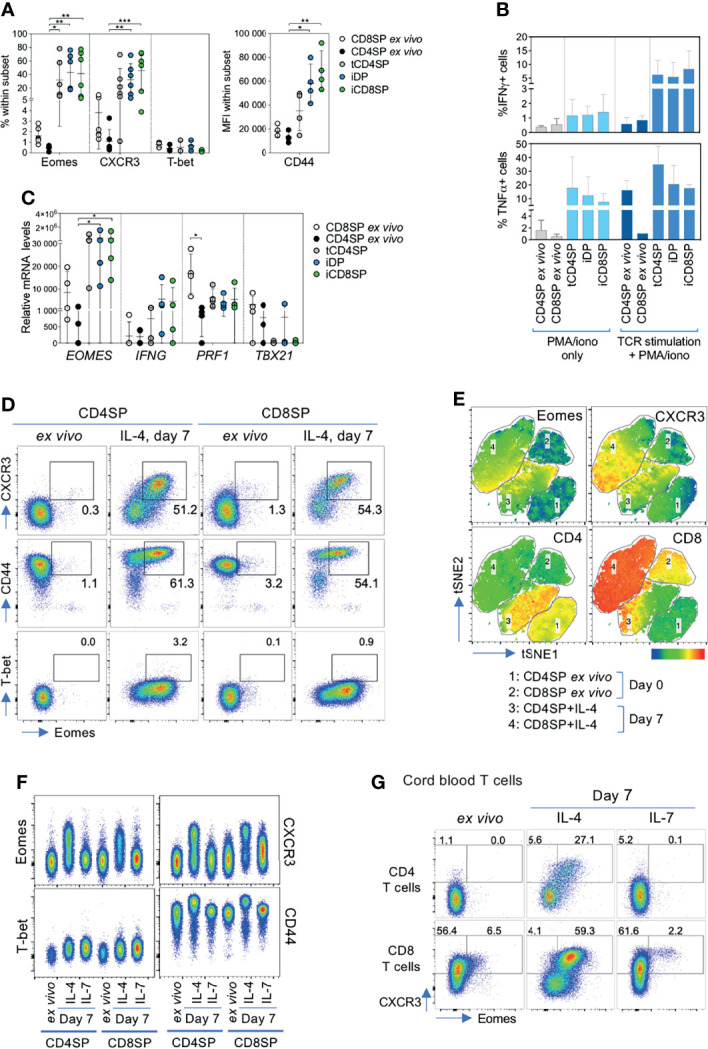
Figure 4.

IL-4 induces an innate phenotype on CD4SP thymocytes and cord blood CD4+ T cells. (A) Frequency of Eomes, CXCR3 and T-bet and MFI of CD44 within CD4SP or CD8SP thymocytes ex vivo, or tCD4SP, iDP and iCD8SP cells 7 days after exposure to IL-4. (B) Frequency of IFN-γ+ and TNF-α+ cells within ex vivo CD4SP and CD8SP thymocytes or cells treated with IL-4 upon stimulation with PMA/ionomycin, both with or without TCR stimulation for 5 days (n=3-5). (C) Transcriptional expression of EOMES, IFNG, PRF1 and TBX21 in CD4SP and CD8SP cells ex vivo or after IL-4 culture. (D) Representative dot plots of Eomes, CXCR3, CD44 and T-bet expression in CD4SP and CD8SP thymocytes ex vivo and after 7 days of culture with IL-4. (E) tSNE clustering analysis of the concatenated flow cytometry data of ex vivo and IL-4-exposed CD4SP and CD8SP cells, based on the following markers: CD3, CD4, CD8α, CD8β, Eomes and CXCR3. Eomes, CXCR3, CD4 and CD8 expression are presented as heatmap overlays over the populations analyzed. (F) Representative dot plots of innate-related markers in CD4SP and CD8SP thymocytes ex vivo and after 7 days of culture with IL-4 or IL-7. (G) Eomes and CXCR3 expression in cord blood CD4+ or CD8+ T cells ex vivo or cultured with IL-4 or IL-7 for 7 days. Results in graphs are presented as mean ± SD. *p < 0.05, **p < 0.01, ***p < 0.001, ***p<0.0001.
