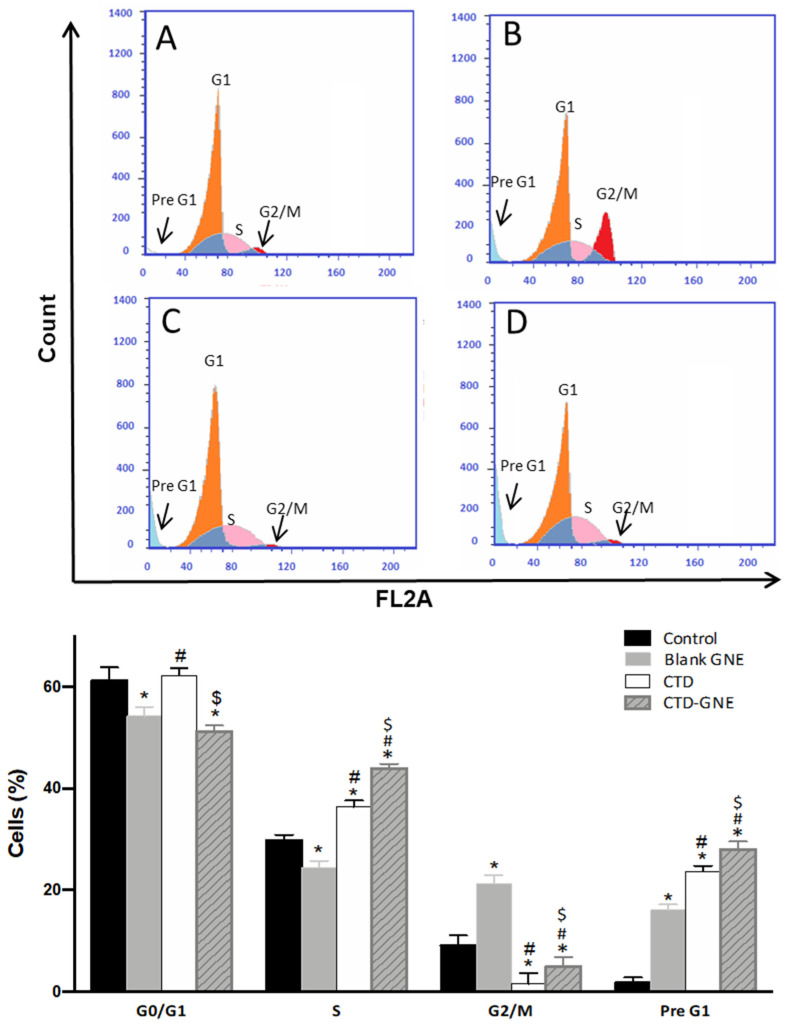
Figure 6.
Analysis of apoptosis via the Annexin-V FITC Staining Kit in A549 cells (A) control, (B) blank GNE, (C) CTD, (D) CTD-GNE using a flow cytometry analysis. All data are expressed as the mean ± SE of three independent experiments. * p < 0.05 is considered significantly different from the control, # p < 0.05 is considered significantly different from blank GNE, and $ p < 0.05 is considered significantly different from CTD.

