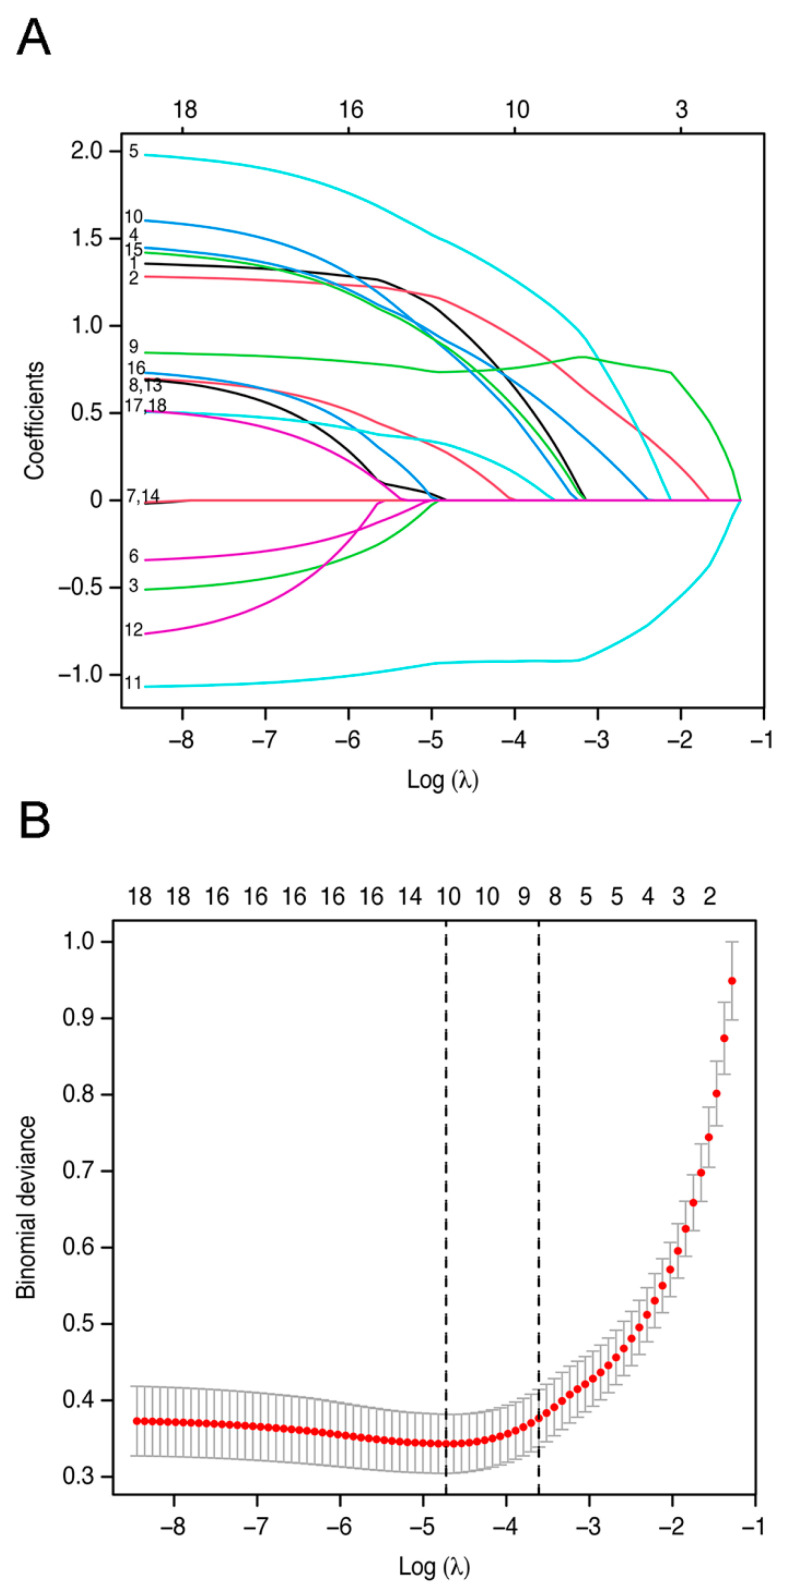
Figure 1.
Indicators included in the model were selected using the least absolute shrinkage and selection operator (LASSO) binary logistic regression model. Figure legends: (A) LASSO coefficient profiles, displaying eighteen texture features. A coefficient profile plot was produced against the log (lambda) sequence. (B) Optimal parameter (lambda) selection in the LASSO model used fivefold cross-validation and minimum criteria. The partial likelihood deviance (binomial deviance) curve was plotted versus log (lambda). Dotted vertical lines were drawn at the optimal values by using the minimum criteria and the 1 standard error (SE) of the minimum criteria (the 1-SE criteria).

