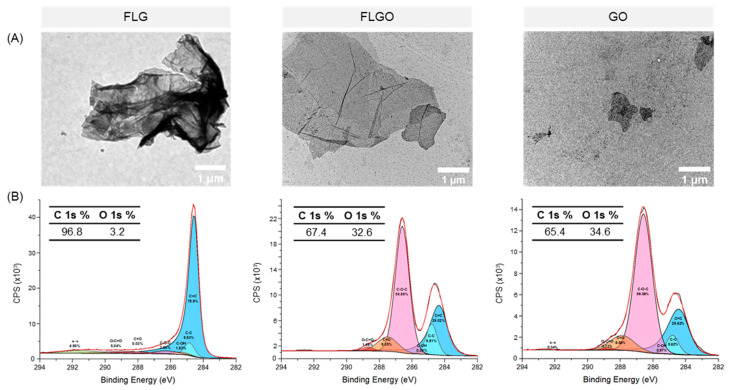
Figure 1.
FLG, FLGO and GO characterization. (A) TEM images of GBM dispersions in water: scale bar = 1 μm. (B) High-resolution C 1s spectra of GBM; percentage of C 1s and O 1s determined from overall survey spectra; and percentage of C=C, C-C, C-OH, C-O-C, C=O, O-C=O and π-π bonds determined by deconvolution of high-resolution spectra.

