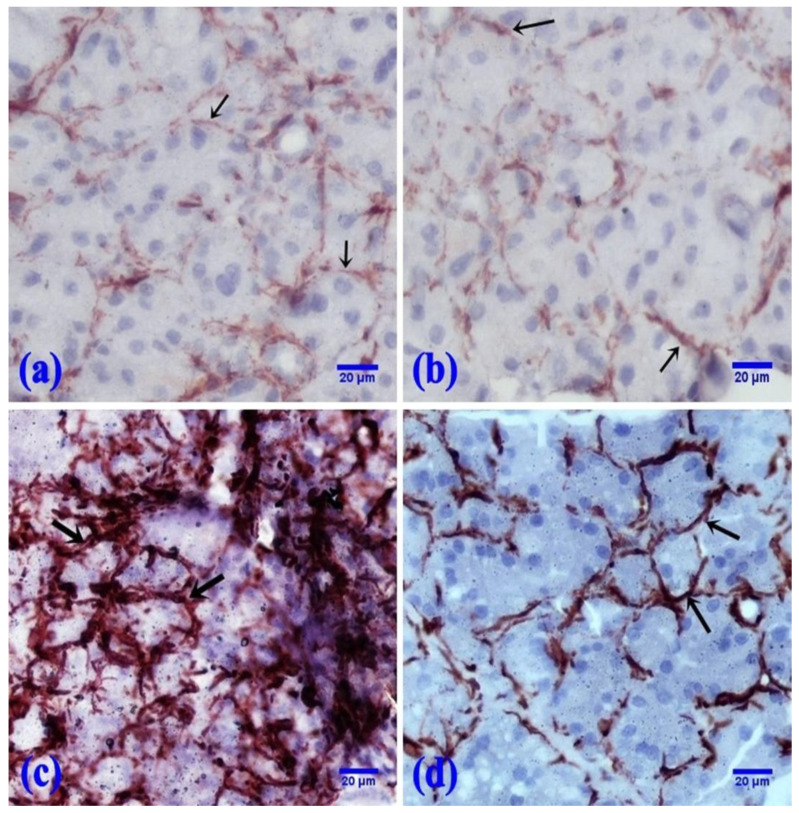
Figure 4.
Photomicrographs of the α-SMA immunoreaction at the periphery of the acini (↑). (a,b) The control and FEB groups, respectively, showed a faint immunoreaction. (c) The 5-FU group showed a marked immunoreaction. (d) The FEB + 5-FU group showed a moderate immunoreaction. (α-SMA immunostaining, ×400; 8 rats/group).

