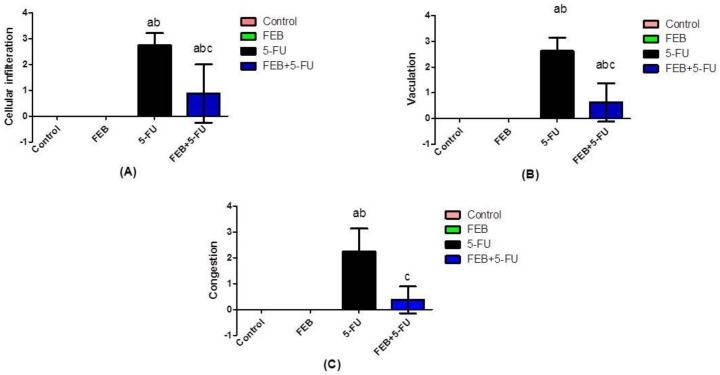
Figure 5.
Scores of the histological findings. Values were expressed as the mean ± S.D. (A) shows the cellular infiltration score. (B) shows the vacuolation score. (C) shows the congestion score. Results were considered significantly different when p < 0.05. a Significant difference relative to the control, b significant difference relative to the FEB group, and c significant difference relative to the 5-FU group. (5-FU: 5-fluorouracil and FEB: febuxostat; 8 rats/group).

