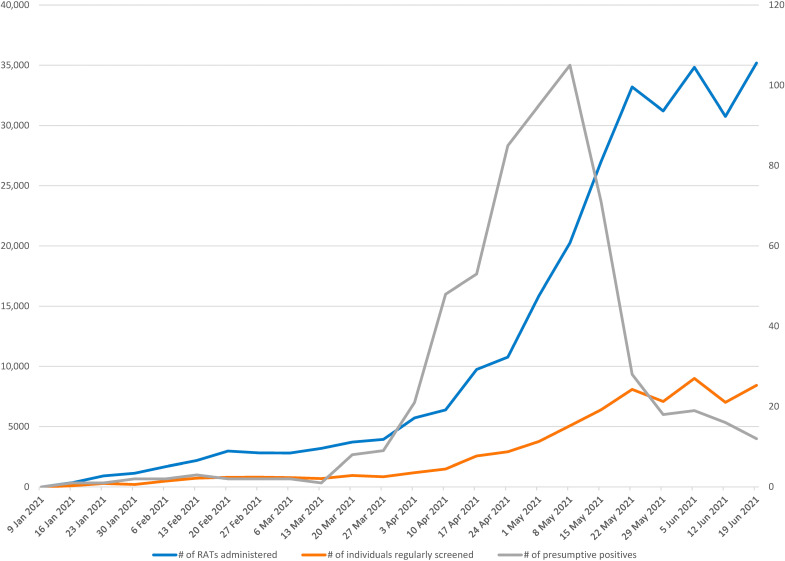
Fig. 3. Total number of RATs administered, the number of employees regularly screening, and the number of presumptive positives (positive on RAT) over time between 11 January 2021 and 25 June 2021.
The total number of RATs and the number of employees regularly screened are counted on the left y axis, and the number of presumptive positives is counted on the right y axis. The calendar date is on the x axis. The lines on the graph represent the number of RATs (blue line), the number of employees that were regularly screening at least twice per week (orange line), and the number of presumptive positives (gray line).

