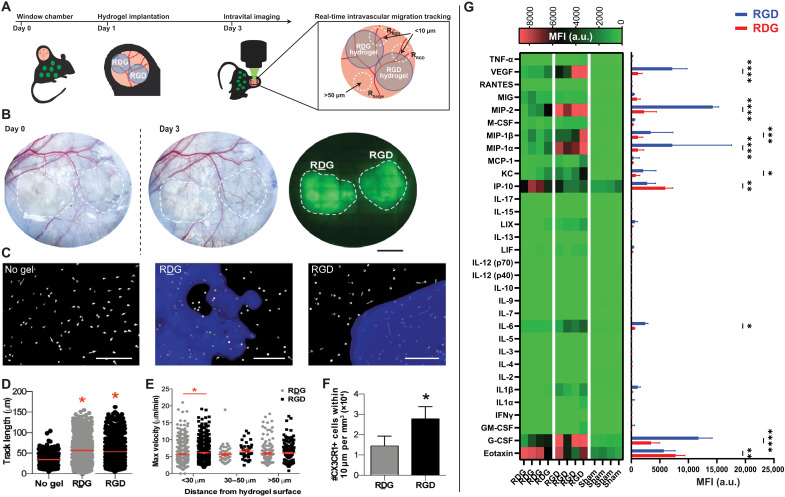
Fig. 1. CX3CR1+ myeloid cells exhibit modified migration patterns around RGD-functionalized hydrogels.
(A) The dorsal skinfold window chamber (DSWC) injury was performed on CX3CR1GFP/+ mice. Two precast PEG-4MAL hydrogels functionalized with RGD or control RDG peptides were implanted side by side onto the exposed cutaneous tissue (internally controlled design) at 1 day after injury, and intravital imaging was performed on day 3. (B) Bright-field images of dorsal tissue at day 0 and day 3 after injury and fluorescent image of tagged hydrogels. Dotted white lines represent location of hydrogel implants (fluorescently tagged hydrogels shown in green). Scale bar, 2 mm. (C) Representative renderings of CX3CR1+ cell displacement vectors generated during image processing to track cell migration. Hydrogels were fluorescently tagged for detection of the hydrogel edge (blue). Scale bar, 100 μm. Quantifications are made from CX3CR1+ cells moving in tissue without a hydrogel or at the interface of hydrogels functionalized with RDG or RGD. (D) Track length (μm), (E) maximum velocity (μm/min) classified according to cells’ minimum distance from the hydrogel surface, and (F) number of CX3CR1+ cells within 10 μm of RDG- and RGD-functionalized hydrogels, normalized to hydrogel volume within each image. The red bar indicates the mean (D and E). *P < 0.05 compared to no gel (D) and compared to RDG-presenting hydrogel (E and F) by Kruskal-Wallis with Dunn’s multiple comparisons (D and E) or Mann-Whitney test (F). n = 219 to 876 cells across three mice. (G) Heatmap visualization of cytokine expression profiles and quantification of lysate extracted from tissues exposed to adhesive (RGD) or nonadhesive (RDG) hydrogels. n = 4 animals *P < 0.05 compared to no gel (D) and compared to RDG-presenting hydrogel (E and F) by Kruskal-Wallis with Dunn’s multiple comparisons. **P < 0.01; ***P < 0.005; ****P < 0.001. a.u., arbitrary units.

