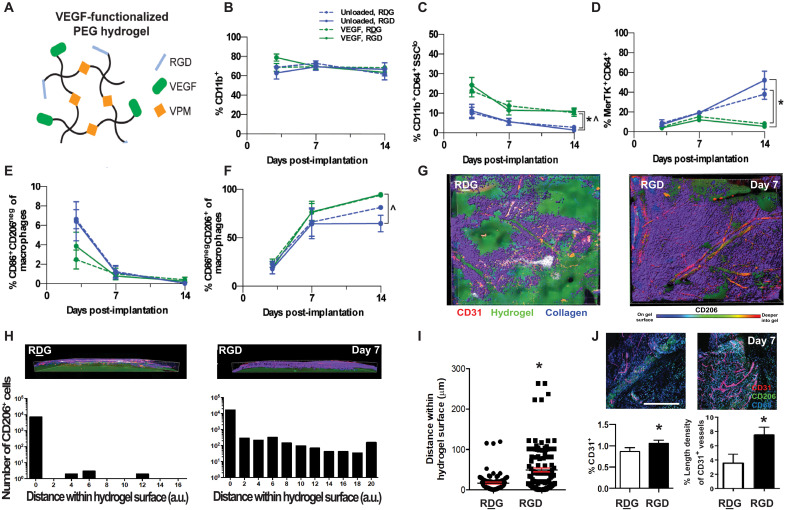
Fig. 3. VEGF-loaded RGD-presenting hydrogels promotes vascularization and macrophage cell infiltration.
(A) Schematic representation of four-arm PEG-MAL macromers functionalized with RGD (or control RDG) peptides and cross-linked with VPM protease–degradable peptide. (B to H) Immune cell subsets quantified by flow cytometry at 3, 7, and 14 dpi into subcutaneous space. All quantifications are normalized to percentage of single cells between unloaded hydrogels (blue) and VEGF-loaded hydrogels (green), functionalized with either RGD (solid line) or RDG (dotted line) peptides. Immune cells analyzed include CD11b+ myeloid cells (B), monocytes (C), macrophages (D), M1 macrophages (E), and M2 macrophages (F). Data expressed as means ± SEM *P < 0.05 compared to unloaded RDG-presenting hydrogel, ^P < 0.05 compared to unloaded RGD-presenting hydrogel by one-way ANOVA at the indicated time point. n = 3 to 11 hydrogels per group. (G) Immunohistochemistry for CD31 (red) and CD206 (purple) was performed 7 dpi of VEGF-loaded hydrogels in DSWCs. Collagen was visualized using second harmonic generation with multiphoton microscopy (blue). The hydrogel was visualized by fluorescently tagging the ligands (RGD and RDG) with Alexa Fluor 405 (green). (H) Quantitative analysis of the number of cells in function to the distance to the hydrogel surface. A significant increase in the number of CD206+ cells is observed at the proximity of the hydrogel surface. (I) Quantitative analysis of the accumulated number of cells near the hydrogel surface. (J) Quantitative analysis of blood vessel length normalized to the analysis region’s area. Scale bar, 100 μm. Data expressed as means ± SEM *P < 0.05 by paired t test. n = 102 cells across six animals per group.

