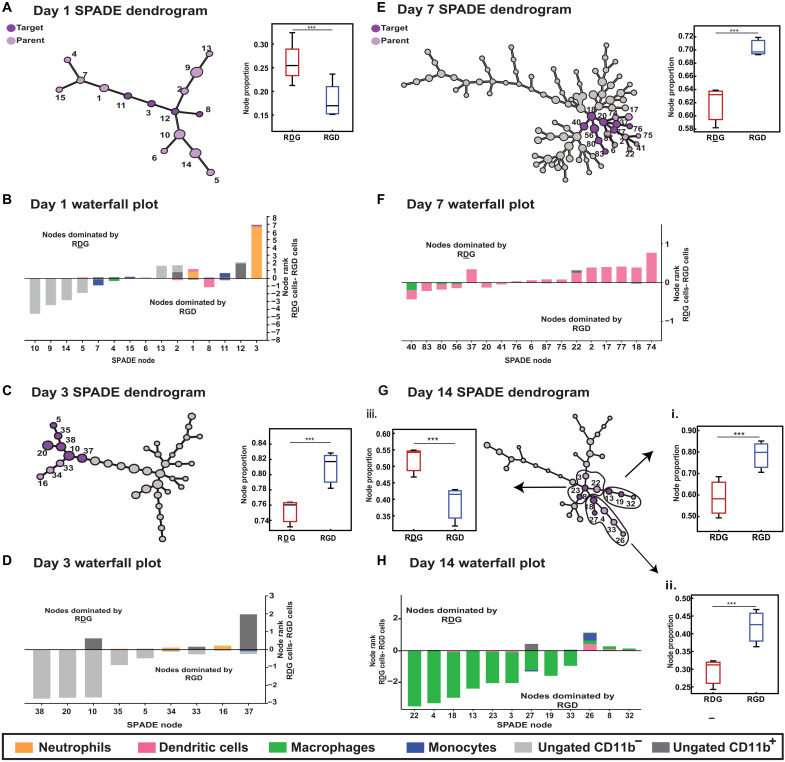
Fig. 5. SPADE pseudo-time dendrogram analysis reveals immune cell heterogeneity at early time points and preferential recruitment of DCs to RDG-presenting hydrogels and macrophages to RGD-presenting hydrogels at later time points.
SPADE dendrograms are generated from single-cell events infiltrating RDG- and RGD-presenting hydrogels at 1, 3, 7, and 14 (A, C, E, and G) dpi. Larger clusters of nodes are identified in which annotated target nodes (dark purple) within a greater parent cluster of nodes (light purple) are significantly different in their recruitment to RGD versus RDG hydrogels at 1, 3, 7, and 14 dpi. Waterfall plots are generated with the SPADE nodes identified in the annotated node clusters for each time point (B, D, F, and H) to visualize the immune cell subsets clustered into each of these nodes and whether they are preferentially recruited to RGD- or RDG-functionalized hydrogels. Numbered SPADE nodes on waterfall plots correspond to numbered nodes on SPADE dendrogram. n = 3 to 4 hydrogels per experimental group. Statistical analysis includes t test multiple comparisons, ***P < 0.001.

