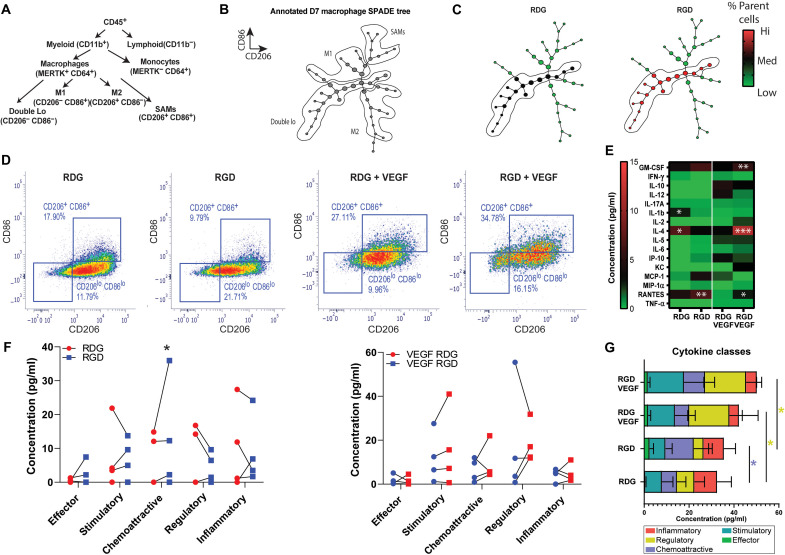
Fig. 6. RGD stimulates cytokine secretion in the SPADE-identified macrophage population.
(A) Classical hematopoietic hierarchy showing the stepwise cell differentiation process. (B) Annotated SPADE tree derived from the cytometry flow data at day 7. (C) SPADE trees colored for the mean percentage of total number of cells. (D) MerTK+CD64+ CD86− CD206− macrophages were FACS-sorted from RGD- or RDG-functionalized hydrogels with or without VEGF at 7 dpi. Biplots show the cell-sorting strategy used. (E) Sorted macrophages were loaded into CodePlex (Isoplexis) chips for multiplexed cytokine analysis. The heatmap shows the median cytokine concentration of sorted double-lo macrophages from RGD- or RDG-functionalized hydrogels with or without VEGF at 7 dpi. (F) Additional dot-plot graphs for paired data of cytokine concentration. (G) Cytokines grouped into classes for each treatment group. *P < 0.05; ***P < 0.01.

