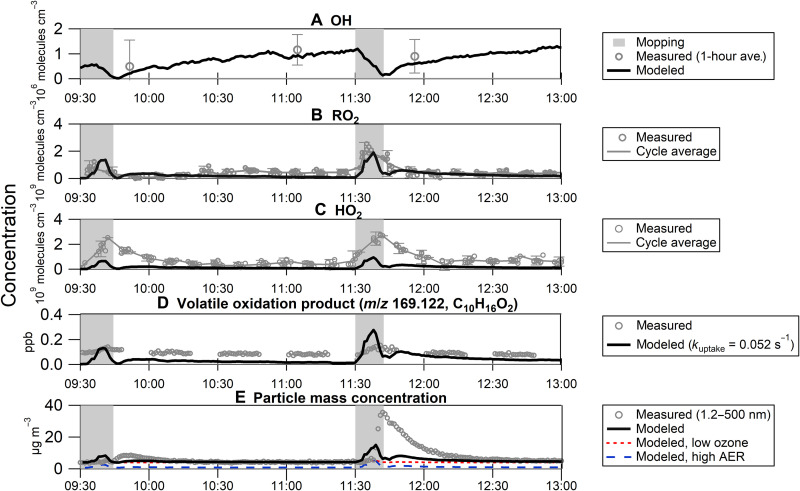
Fig. 4. Measurements and model predictions.
(A) OH, (B) RO2, (C) HO2 radical, and (D) possible oxidation product (limonaldehyde, C10H16O2) concentrations, and (E) size-integrated particle mass concentrations (1.2 to 500 nm) based on monoterpene, O3, and NOx concentrations and NO2 photolysis frequencies. Gray shading corresponds to active periods of mopping and wiping during the cleaning events. OH, HO2, and RO2 are compared to measured radical concentrations; OH values are close to the limit of detection and are shown here as 1-hour averages. Error bars shown are 1σ for OH and 2σ for HO2 and RO2. In (D), a pseudo first-order rate constant of k = 0.052 s−1 was taken to be representative of the loss to room walls and surfaces. In (E), a constant source rate of 18 μg m−3 hour−1 was considered. For the low-O3 model, O3 concentrations were divided 16-fold to reach a maximum concentration of 0.6 ppb. For the higher-AER model, the AER was increased to 24 hour−1.

