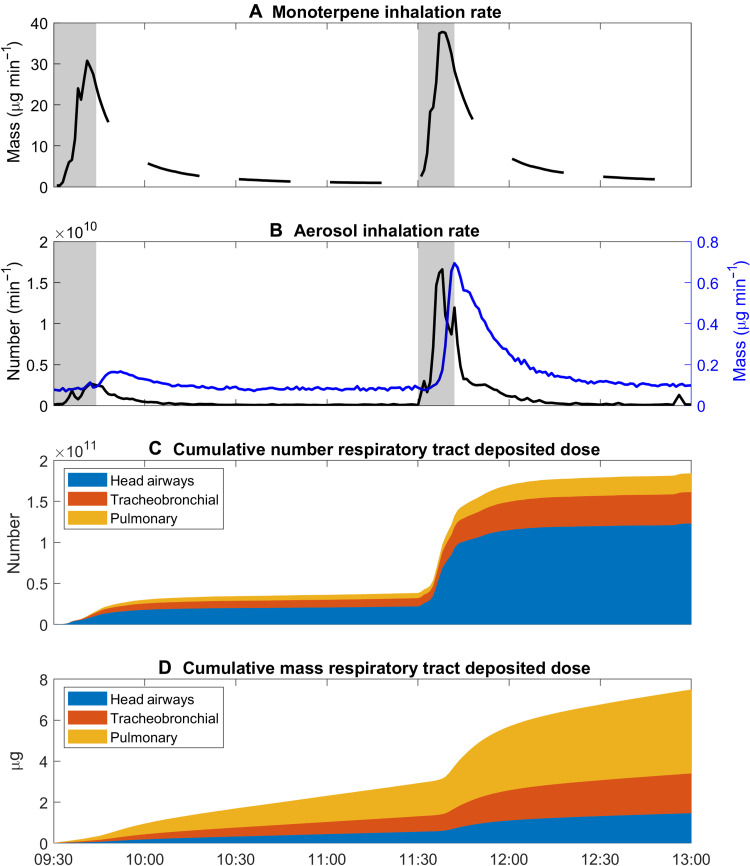
Fig. 5. Time series of inhalation rates and cumulative respiratory tract deposited doses.
(A) Mass inhalation rate for monoterpenes, (B) size-integrated number (black) and mass (blue) inhalation rates for aerosols, (C) cumulative number respiratory tract deposited dose, and (D) cumulative mass respiratory tract deposited dose. The cumulative dose is taken as the time and size integration of dRTDDRN/M/dLogDp.

