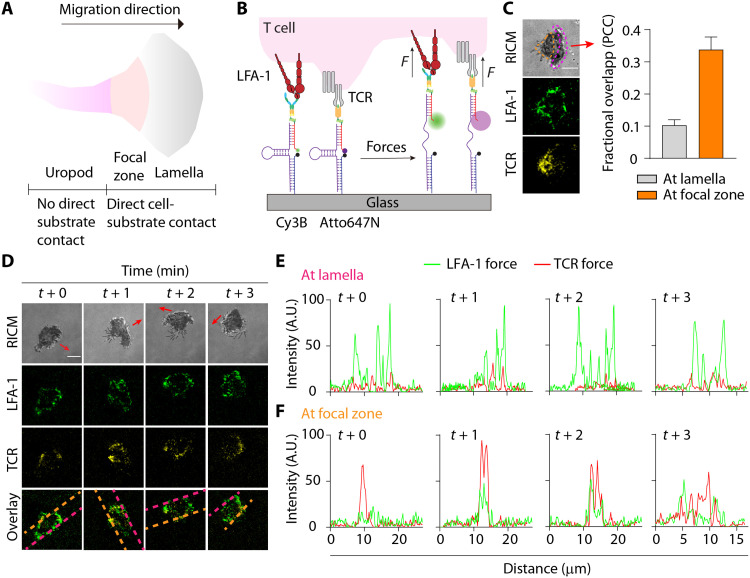
Fig. 3. Spectrally encoded, multiplexed extracellular DNA-based TCR and LFA-1 tension probes.
(A) Morphology of a migrating T cell. (B) Design of multiplexed real-time DNA-based tension probes for simultaneous mapping of TCR and LFA-1 forces. (C) RICM, LFA-1, and TCR tension images show a migrating OT-1 cell used LFA-1 and TCR to generate forces at spatially distinct regions. Red arrow indicates the direction of migration. Colocalization analysis confirmed the lack of colocalization at the lamella and moderate colocalization at the focal zone. n = 15 cells; orange dashed region, focal zone; pink dashed region, lamella. PCC, Pearson’s correlation coefficient. (D) Time-lapse images showing cell footprint and spatial segregation of the LFA-1 and TCR forces. Representative RICM and tension maps of the LFA-1 (F1/2 = 4.7 pN, green), TCR (F1/2 = 4.7 pN, yellow), and the overlay channel of a single migrating OT-1 cell were shown. For C and D, red arrows indicate the direction of migration. Scale bar, 5 μm. (E) Plots display lamella tension signals generated by the LFA-1 and the TCR as a function of time within the line of interest (pink dashed lines) as shown in the overlay channel in (D). (F) Plots display focal zone tension signals generated by the LFA-1 and the TCR as a function of time within the line of interest (orange dashed lines) as shown in the overlay channel in (D). Error bar represents means ± SEM. Scale bar, 5 μm. Probe densities = ~1000 molecules/μm2. AU, arbitrary units.

