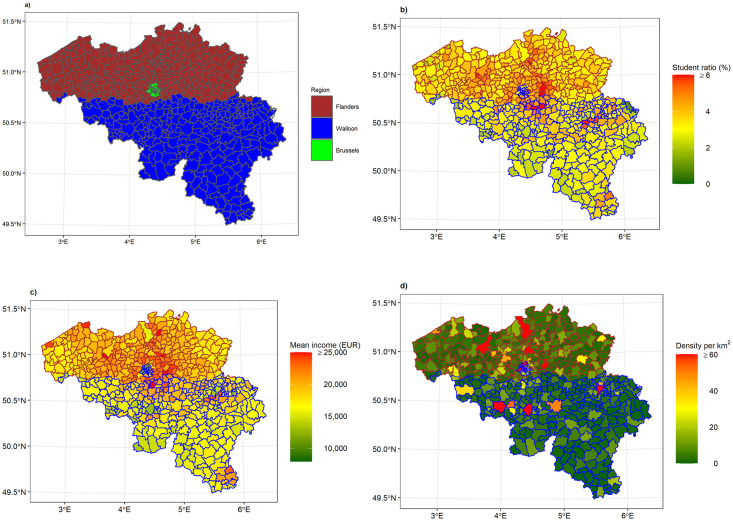
Fig 3. Descriptive map of Belgium.
The regional division is depicted in (a). Distribution per municipality of student ratio, yearly mean income, and population density are depicted in (b), (c), and (d), respectively. The red border in (b), (c), and (d) indicates the Flanders Region and the blue border indicates the Brussels and Walloon Regions.

