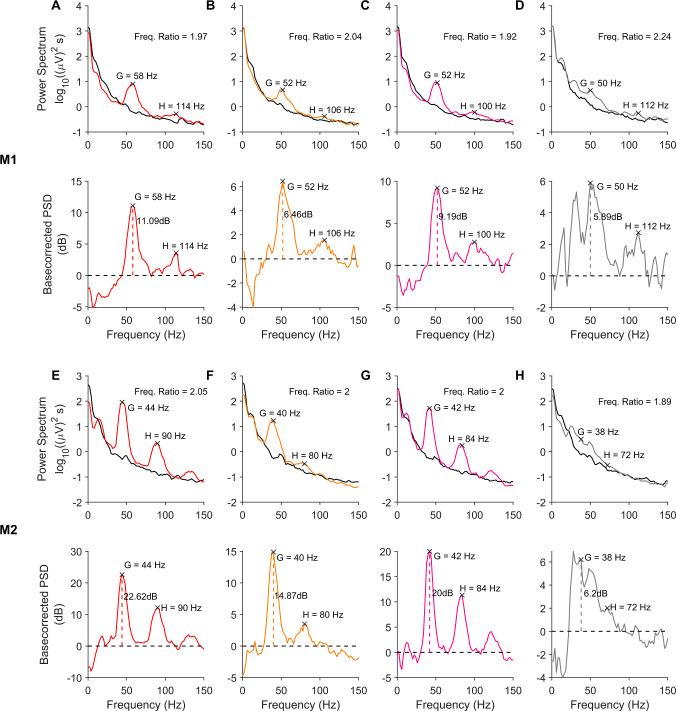
Fig 1. Visual Stimulation induces narrowband activity in gamma and its harmonic bands.
(A-D, top row) PSDs for baseline (-500 to 0 ms; 0 indicates stimulus onset) and stimulus (250 to 750 ms) periods for different stimuli, averaged across trials and electrodes, from monkey 1 (M1). The baseline PSDs are plotted in black, while the stimulus period PSDs are colored (corresponding to the hue presented) or grey (for fullscreen grating). (A-D, bottom row) show the change in power (dB) in the stimulus period from the baseline, computed from the PSDs in the top row. The gamma power computed from the change in power spectrum is represented by vertical dashed line). The peaks in gamma range and the second bump activity are marked in each plot. (E-H) Same as A-D, for monkey M2.

