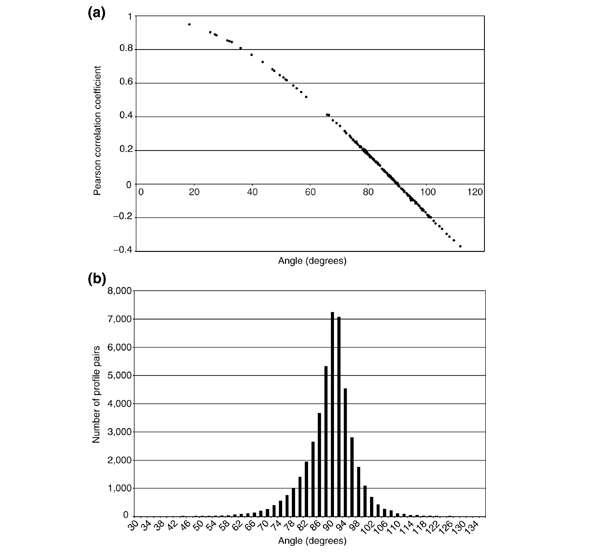
Figure 2.

The relationship between the Pearson correlation coefficient and angle, and the statistical distribution of angles. (a) The Pearson correlation coefficients and the angles between 180 pairs of actual transcription profiles were computed. Plotting one measure against the other reveals their close relationship. (b) The statistical distribution of angles in a large, diverse data set (300 profiles) [19] was computed by calculating angles between all possible pairs (a total of 44,850 angles) of expression vectors. Data were taken from the Rosetta Inpharmatics website [34] and the software used to compute the angles is publicly available for download from our website [20].
