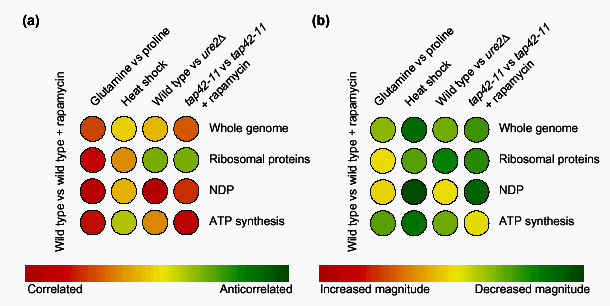
Figure 3.

An illustration of the use of the colorimetric comparison array (CCA) to infer information about a cellular signaling network. (a) Using competitive hybridization data from a study of the target of rapamycin (Tor) proteins) [11], the angles between a reference expression vector of a wild-type strain treated with rapamycin and four other expression vectors are represented on a CCA. The profile of cells shifted from glutamine to proline shows that at a whole-genome level, and within the subspaces shown, there is strong similarity (44° at a whole-genome level) to a profile of cells treated with rapamycin. Cells that have undergone heat shock, however, have an orthogonal (uncorrelated) expression vector. Deleting the gene URE2 (ure2Δ) does not generate whole-genome correlation, but does generate correlation within the subspace of nitrogen-discrimination pathway (NDP) genes. Finally, cells containing the tap42-11 allele of TAP42 that are treated with rapamycin illustrate that Tap42p is downstream of the Tor proteins in the control of ribosomal protein gene expression. (b) A similar analysis to that in (a) can be carried out using ratios of vector magnitudes (α). The overall greenness of the CCA reflects the fact that these four expression vectors have a smaller magnitude than the reference rapamycin-treatment profile. The magnitude of the whole-genome expression vector of heat shock is considerably smaller. Deleting URE2, however, increases the magnitude of expression of the NDP subspace of genes to levels comparable to those of cells treated with rapamycin. When TAP42 is mutated to the tap42-11 allele, NDP gene induction is severely impaired, implicating Tap42p as an important regulator of NDP gene expression downstream of the Tor proteins. Iterating this analysis over many effectors and many subspaces of genes reveals a wealth of information about the transcriptional network downstream of the Tor proteins [11].
