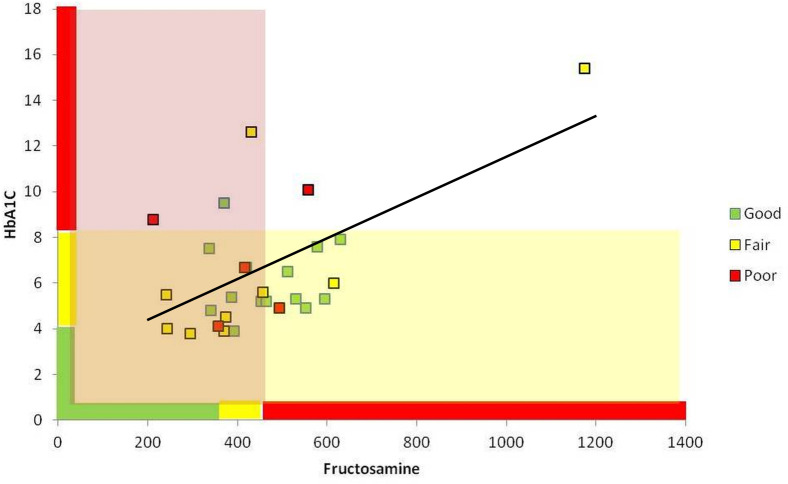
Fig 1. Relationships between classifications of glycemic control in study dogs by CST, blood HbA1c, and serum fructosamine.
Individual dogs are represented by colored squares. The color of each square indicates glycemic classification determined using the gold standard (CST) assessment: GOOD–green, FAIR–yellow, POOR–red. The position of each square on the graph is determined by the dog’s serum fructosamine concentration (x-axis) and blood HbA1c concentration (y-axis). Respective cut-offs and ranges for classification using fructosamine and HbA1c are indicated by the color-coded bars along each axis (GOOD–green, FAIR–yellow, POOR–red). The pale red area indicates dogs classified as having ACCEPTABLE control by the serum fructosamine test. The pale-yellow area indicates dogs classified as having ACCEPTABLE control by the blood HbA1c test. Dogs that fall into the area of overlap (pale orange) were classified as having ACCEPTABLE control by both tests. Blood HbA1c (%) and serum fructosamine (μmol/l) concentrations showed a significant correlation among the study group (n = 28 dogs). Pearson’s R = 0.578; p = 0.001.

