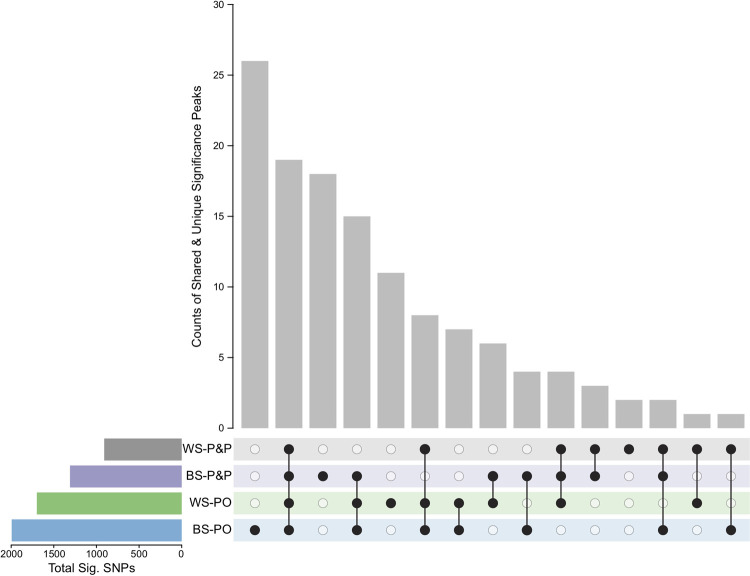
Fig 4. Breakdown of significance peaks from Model 2.
The counts of significance peaks are shown along with the combination of regimes contributing to that count. Unique peaks are represented by a single black dot for the given regime. Shared peaks have multiple connected black dots. The total number of significant SNPs within each regime is given.

