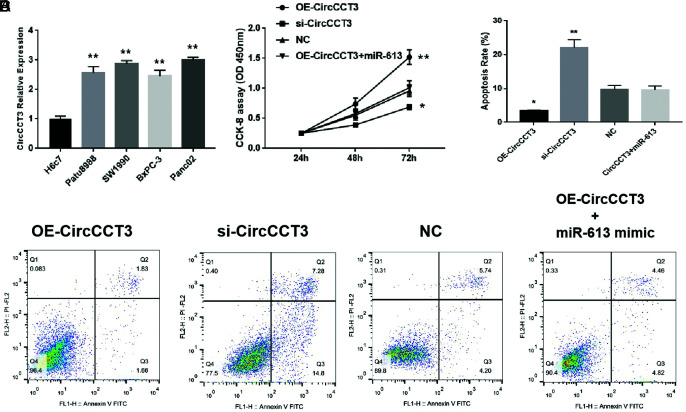
FIG. 2.
(A-D). Data are shown as mean ± SD. (A) Comparison of CircCCT3 levels between the normal cell line H6c7 and different tumor cell lines. (B) Proliferation rate following OE-CircCCT3 or si-CircCCT3 transfection. (C) Comparison of apoptosis rate following OE-CircCCT3 or si-CircCCT3 transfection. (D) Representative figures of cell apoptosis following OE-CircCCT3 or si-CircCCT3 transfection.

 Content of this journal is licensed under a