
Figure 2. Age-related change in gene expression variation among tissues estimated with coefficient of variation (CoV).
(a) Transcriptome-wide mean CoV trajectory with age. Each point represents the mean CoV value of all protein-coding genes (15,063) for each mouse (n = 15) except the one that lacks expression data in the cortex. (b) Age effect on CoV value of the Cd93 gene which has the highest rank for the divergence-convergence (DiCo) pattern in four tissues (Materials and methods). CoV increases during development and decreases during ageing, indicating expression levels show DiCo patterns among tissues. (c) Expression trajectories of the gene Cd93 in four tissues. (d) The number of significant CoV changes with age (false discovery rate [FDR]-corrected p-value<0.1) during development (left, nconverge = 772, ndiverge = 1809) and ageing (right, nconverge = 42, ndiverge = 20). Converge: genes showing a negative correlation (ρ) between CoV and age; diverge: genes showing a positive correlation between CoV and age. (e) Log2 ratio of convergent/divergent genes in development and in ageing. The graph represents only genes showing significant CoV changes (FDR-corrected p-value<0.1, given in panel d). Error bars represent the range of log2 ratios calculated from leave-one-out samples using the jackknife procedure (Materials and methods, values are given in Figure 2—source data 1).

Figure 2—figure supplement 1. Age-related change in coefficient of variation (CoV) summarised across genes using median CoV values.
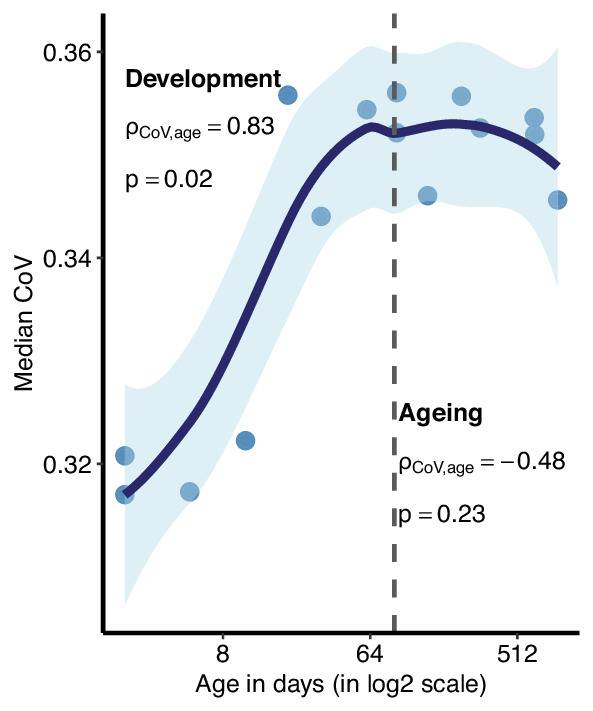
Figure 2—figure supplement 2. Clustering of divergence-convergence (DiCo) genes by expression variations (coefficient of variation [CoV]) among tissues.
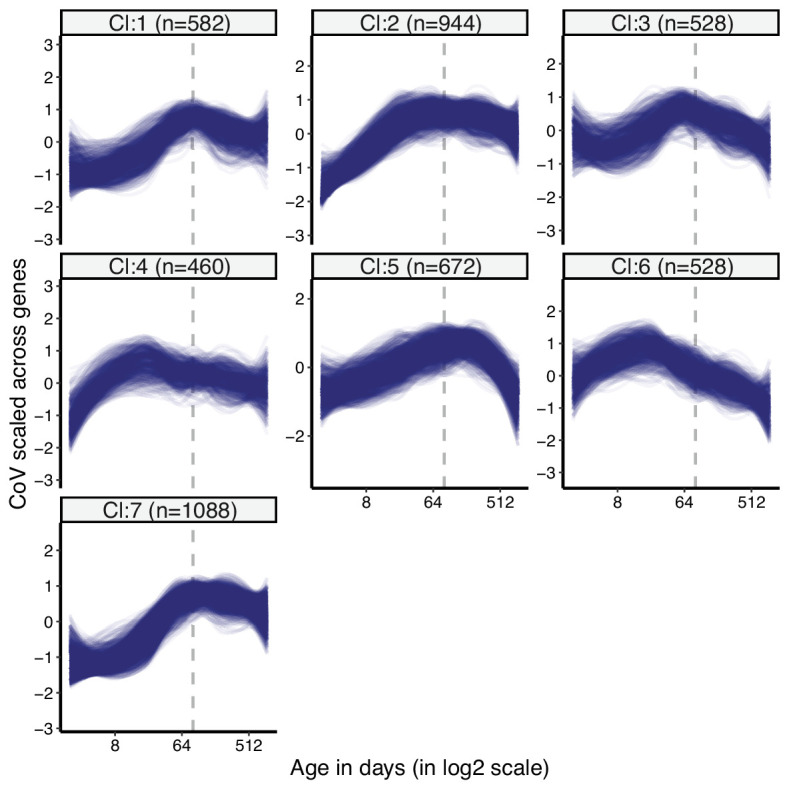
Figure 2—figure supplement 3. Clustering of divergence-convergence (DiCo) genes by expression levels in tissues.

Figure 2—figure supplement 4. Number of genes with inter-tissue divergence and convergence tendencies in development and ageing.
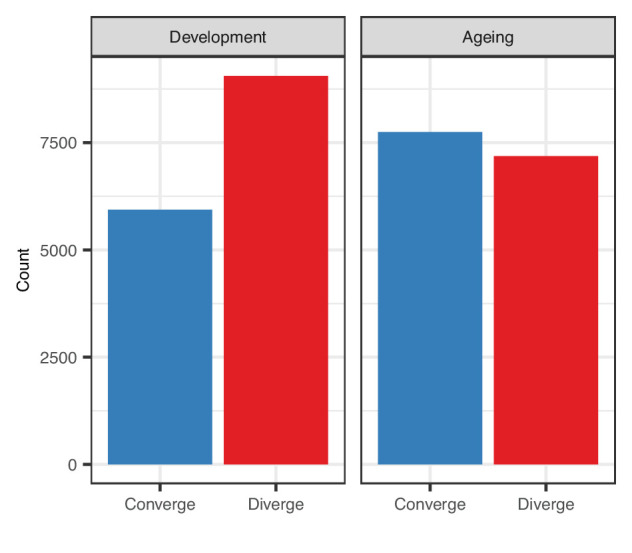
Figure 2—figure supplement 5. Pairwise tissue expression correlations.

Figure 2—figure supplement 6. Summary of pairwise expression correlations among tissues.

Figure 2—figure supplement 7. Coefficient of variation (CoV) and pairwise correlation analysis of Jonker dataset.

Figure 2—figure supplement 8. Principal components analysis (PCA) of GTEx dataset covering cortex, liver, lung, and muscle tissues.

Figure 2—figure supplement 9. Coefficient of variation (CoV) and pairwise correlation analysis of GTEx dataset covering cortex, liver, lung, and muscle tissues.

Figure 2—figure supplement 10. Principal components analysis (PCA) of GTEx dataset with 10 tissues.

Figure 2—figure supplement 11. Coefficient of variation (CoV) and pairwise correlation analysis of GTEx dataset with 10 tissues.

Figure 2—figure supplement 12. Permutation test result for the proportion of divergence-convergence (DiCo) genes.

Figure 2—figure supplement 13. Clustering of tissues by the presence of samples from the same individuals.

Figure 2—figure supplement 14. Reproducing Figure 2 results with variance stabilising transformation (VST) normalisation.

Figure 2—figure supplement 15. Effect of heteroscedasticity to divergence-convergence (DiCo) pattern.

Figure 2—figure supplement 16. Sex effect on coefficient of variation (CoV) analysis using GTEx.

Figure 2—figure supplement 17. Principal components analysis (PCA) of Schaum dataset covering cortex, liver, lung, and muscle tissues.

Figure 2—figure supplement 18. Coefficient of variation (CoV) and pairwise correlation analysis of Schaum dataset covering cortex, liver, lung, and muscle tissues.

Figure 2—figure supplement 19. Principal components analysis (PCA) of Schaum dataset with eight tissues.

Figure 2—figure supplement 20. Coefficient of variation (CoV) and pairwise correlation analysis of Schaum dataset with eight tissues.
