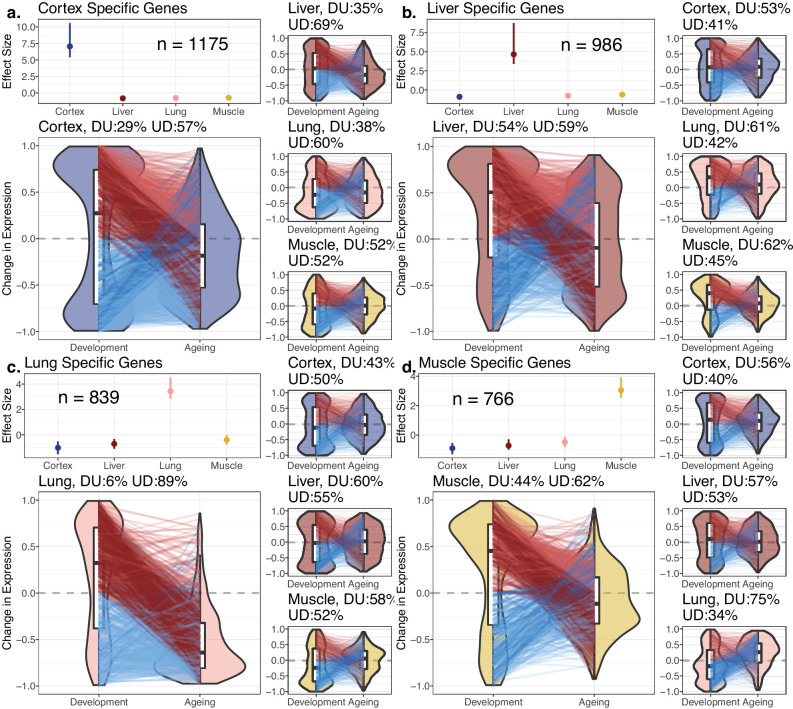
Figure 3. Reversal patterns among tissue-specific genes.
Age-related expression changes of the tissue-specific genes. In each panel (a–d), the upper-left subpanels show effect size (ES) calculated with the Cohen’s d formula, using expression levels of each gene among tissues (Materials and methods). The IQR (line range) and median (point) ES for each tissue are shown. The number of tissue-specific genes is indicated inside each subpanel. The lower-left subpanels show violin plots of the distribution of age-related expression change values (Materials and methods) among tissue-specific genes in development and in ageing. Each quadrant represents the plots for each tissue-specific gene group. The red and blue lines connect gene expression changes for the same genes in development and ageing. DU: percentage of down-up reversal genes among downregulated, tissue-specific genes in development; UD: percentage of up-down reversal genes among upregulated, tissue-specific genes in development. Tissue-specific genes are enriched among UD reversal genes except in the liver (Fisher’s exact test; ORcortex = 1.65, ORlung = 6.52, ORliver = 0.87, ORmuscle = 1.26, p<0.05 for each test except in liver).

