. 2022 Jan 31;11:e68048. doi: 10.7554/eLife.68048

Figure 5. Contribution of tissue composition and cell-autonomous changes to the divergence-convergence (DiCo) pattern.

(a) Deconvolution analysis of our mouse dataset with the 3-month-old scRNA-seq data (Tabula Muris Senis) using DiCo (n = [4007, 4106]) and non-DiCo (n = [8485, 8743]) genes. Only the cell types with the highest relative contributions to each tissue bulk transcriptome are shown (cell-type names are given within each plot). Contributions of all cell types to bulk tissue transcriptomes are shown in Figure 5—figure supplement 1. (b) Distribution of correlations for minimally (left) and maximally (right) correlated cell-type pairs among tissues (n = 54 pairs). For each cell type of a given tissue, one minimally (or maximally) correlated cell type is chosen from other tissues among the 3-month age group of the Tabula Muris Senis dataset (density plots with solid line edges). Dashed lines show the correlation distributions in 24-month age of minimally or maximally correlated cell-type pairs identified in the 3-month age group. Bottom panel shows age-related expression similarity (ρ) changes of minimally (left) and maximally (right) correlated cell-type pairs. The correlation between age and tissue similarity (expression correlations) was calculated for each pair of cell types identified in the 3-month age group. All pairwise cell-type correlations and their age-related changes are given in Figure 5—source data 1.

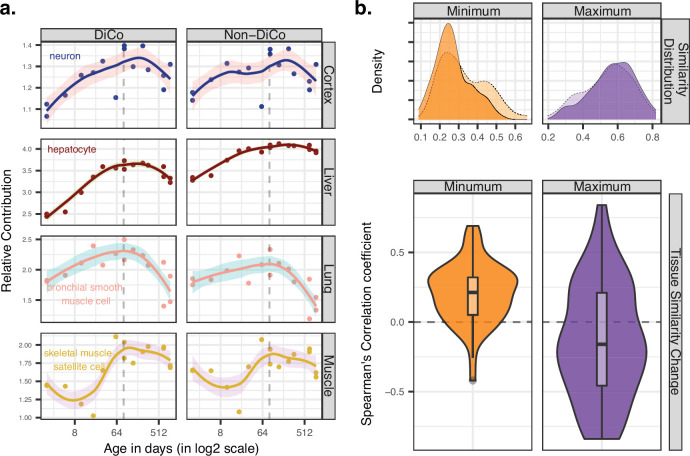
Figure 5—source data 1. Cell-type proportion estimation and cell-autonomous changes using the Tabula Muris Senis dataset.

Figure 5.

Figure 5—figure supplement 1. Age-related changes in cell-type proportions calculated using divergence-convergence (DiCo) and non-DiCo genes.

Figure 5—figure supplement 1.

Deconvolution of bulk tissue expression profiles of the mice in our dataset with regression analysis using the single-cell expression profile of the 3-month-old mice in the Tabula Muris Senis dataset for cortex (a), liver (b), lung (c) and muscle (d). Contribution of each cell type was measured using three gene sets; all genes (n = [12,492, 12,849]), DiCo (n = [4007, 4106]), and non-DiCo genes (n = [8485, 8743]). Age-related changes of the relative contribution of each cell type in each tissue are given in Figure 5—source data 1.
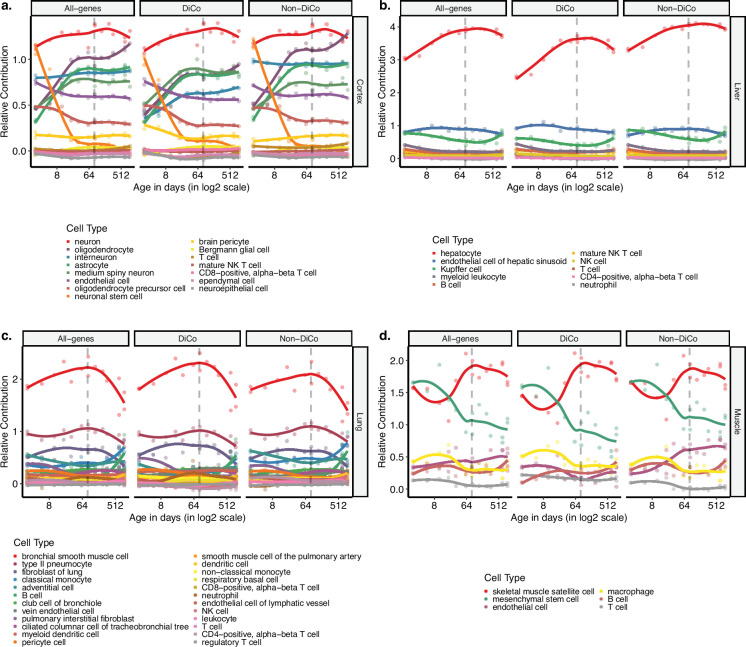
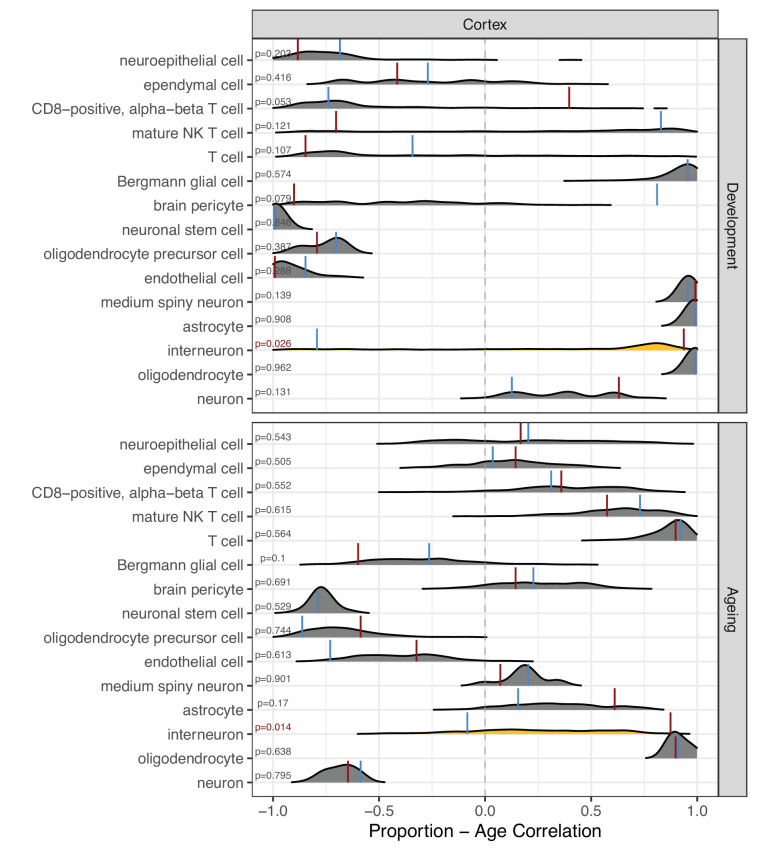
Figure 5—figure supplement 2. Permutation-based comparison between divergence-convergence (DiCo) and non-DiCo-related cell-type proportion changes with age in the cortex.

Figure 5—figure supplement 2.

The difference between DiCo (4106) and non-DiCo (8743)-related cell-type proportion changes with age was tested in the cortex tissue. The x-axis is the Spearman’s correlation coefficient between age and relative contribution of a given cell type. The red vertical lines show the cell-type proportion changes calculated with DiCo genes (observed value), and the blue vertical lines indicate the same but with non-DiCo genes. Overlapping DiCo and non-DiCo values are indicated with blue. Null distributions for non-DiCo genes (density plots) were created with resampling among all genes (n = 12,849) (Materials and methods). Significant results are represented with yellow density plots, and the nominal p-values for permutation tests are indicated on the left side of the density plots. Permutation test results are also provided in Figure 5—source data 1.
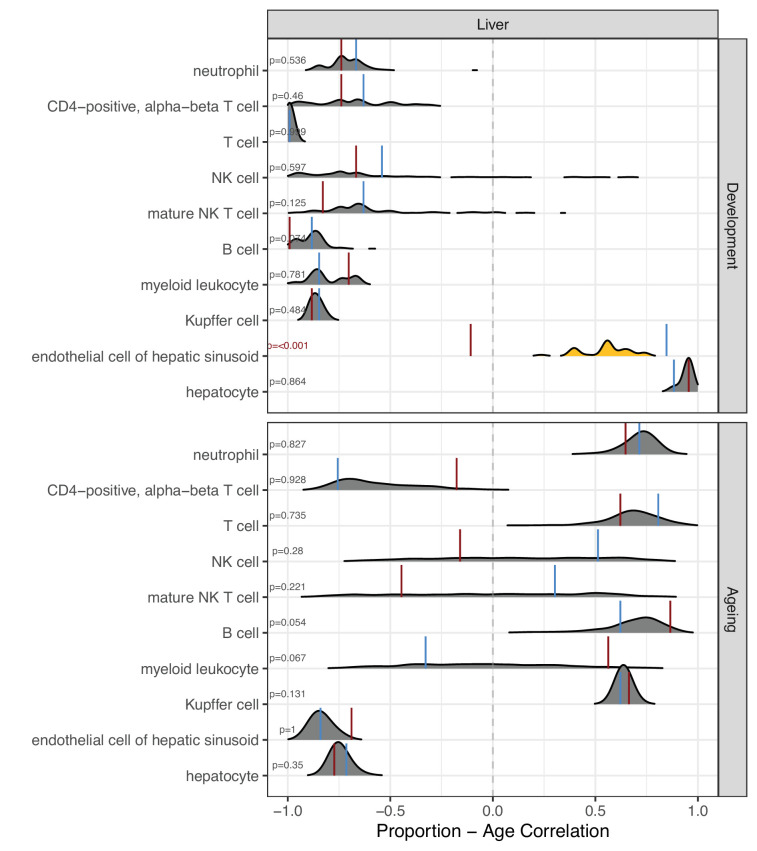
Figure 5—figure supplement 3. Permutation-based comparison between divergence-convergence (DiCo) and non-DiCo-related cell-type proportion changes with age in the liver.

Figure 5—figure supplement 3.

The difference between DiCo (4007) and non-DiCo (8485)-related cell-type proportion changes with age was tested in the liver tissue. The x-axis is the Spearman’s correlation coefficient between age and relative contribution of a given cell type. The red vertical lines show the cell-type proportion changes calculated with DiCo genes, and the blue vertical lines indicate the same but with non-DiCo genes. Overlapping DiCo and non-DiCo values are indicated with blue. Null distributions for non-DiCo genes (density plots) were created with resampling among all genes (n = 12,492) (see Materials and methods). Significant results are represented with yellow density plots, and the nominal p-values for permutation tests are indicated on the left side of the density plots. Permutation test results are provided in Figure 5—source data 1.
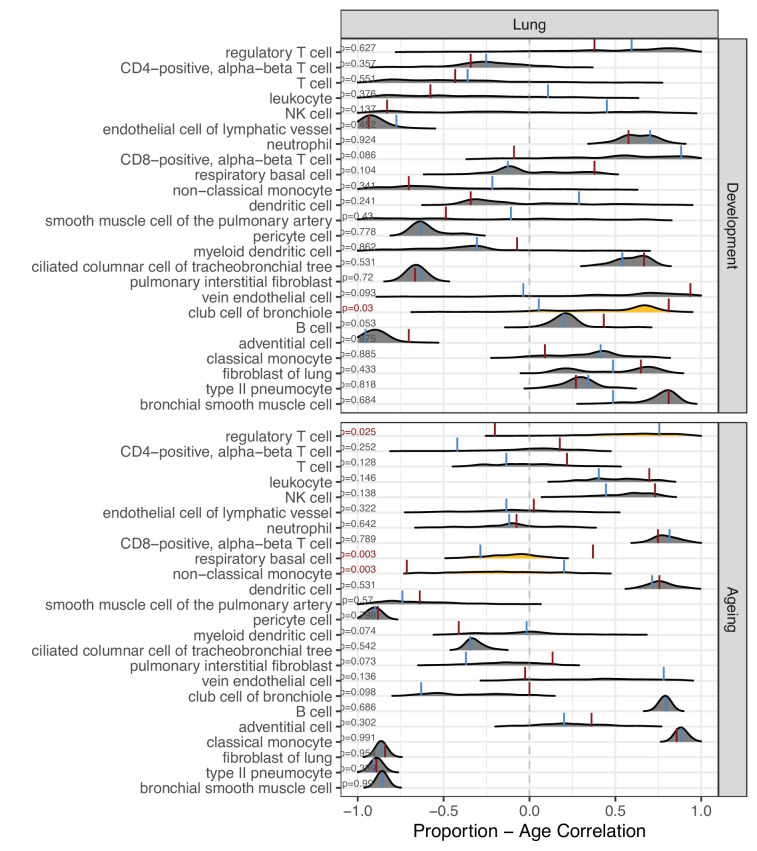
Figure 5—figure supplement 4. Permutation-based comparison between divergence-convergence (DiCo) and non-DiCo-related cell-type proportion changes with age in the lung.

Figure 5—figure supplement 4.

The difference between DiCo (4084) and non-DiCo (8670)-related cell-type proportion changes with age was tested in the lung tissue. The x-axis is the Spearman’s correlation coefficient between age and relative contribution of a given cell type. The red vertical lines show the cell-type proportion changes calculated with DiCo genes, and the blue vertical lines indicate the same but with non-DiCo genes. Overlapping DiCo and non-DiCo values are indicated with blue. Null distributions for non-DiCo genes (density plots) were created with resampling among all genes (n = 12,754) (see Materials and methods). Significant results are represented with yellow density plots, and the nominal p-values for permutation tests are indicated on the left side of the density plots. Permutation test results are provided in Figure 5—source data 1.
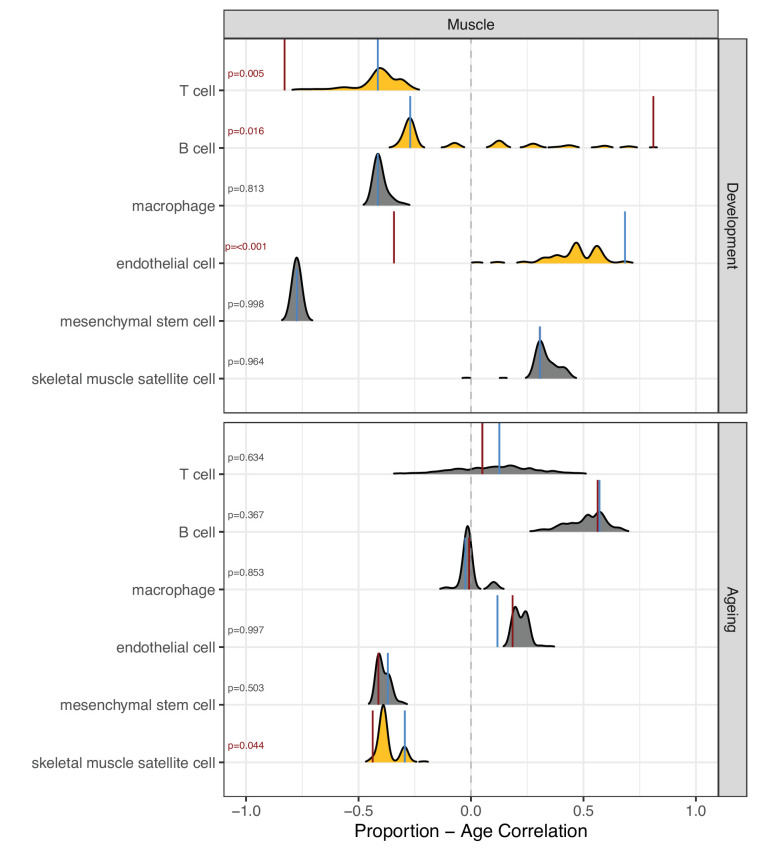
Figure 5—figure supplement 5. Permutation-based comparison between divergence-convergence (DiCo) and non-DiCo-related cell-type proportion changes with age in the muscle.

Figure 5—figure supplement 5.

The difference between DiCo (4055) and non-DiCo (8568)-related cell-type proportion changes with age was tested in the muscle tissue. The x-axis is the Spearman’s correlation coefficient between age and relative contribution of a given cell type. The red vertical lines show the cell-type proportion changes calculated with DiCo genes, and the blue vertical lines indicate the same but with non-DiCo genes. Overlapping DiCo and non-DiCo values are indicated with blue. Null distributions for non-DiCo genes (density plots) were created with resampling among all genes (n = 12,623) (see Materials and methods). Significant results are represented with yellow density plots, and the nominal p-values for permutation tests are indicated on the left side of the density plots. Permutation test results are provided in Figure 5—source data 1.
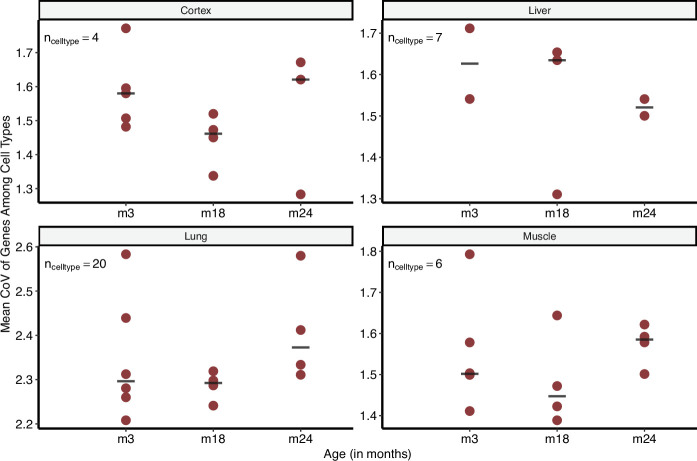
Figure 5—figure supplement 6. Intra-tissue coefficient of variation (CoV) changes between cell types using the Tabula Muris Senis dataset.

Figure 5—figure supplement 6.

Intra-tissue CoV: CoV is calculated among cell types within each tissue for each individual mouse and in three age groups. Y-axis shows the mean CoV value of genes for each individual. The horizontal line on each age group shows the median of points. Cell types found in at least two individuals at every time point were considered.