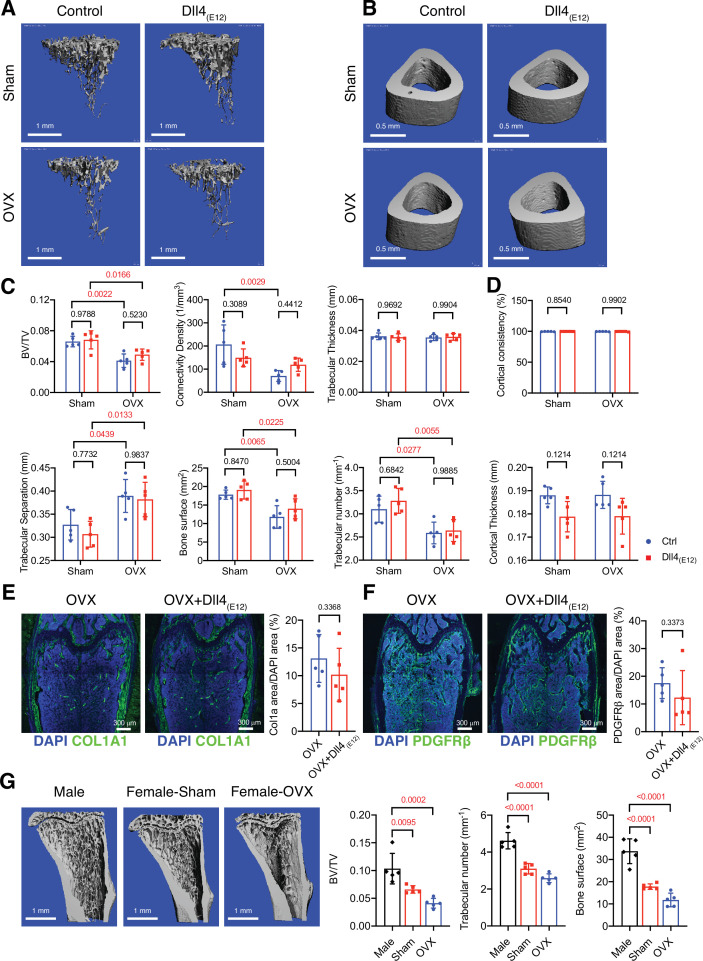
Figure 6. Bone formation is not increased by Dll4(E12) in ovariectomized female mice.
(A, B) Representative 3D micro-computed tomography (μ-CT) images of trabecular bone in the distal tibial metaphysis (A) and cortical bone in the mid-tibial diaphysis (B) of sham or ovariectomized mice treated with vehicle or pLIVE-Dll4(E12). (C) Bone parameters measured by μ-CT analysis of trabecular bone volume/total volume, trabecular connectivity density, trabecular thickness, trabecular separation, bone surface, and trabecular number in the distal tibial metaphysis. Data represent mean ± SD. (n = 5 mice) (p-values determined by two-way ANOVA with Tukey’s multiple comparisons test). (D) Quantitation of μ-CT analysis of cortical bone consistency and cortical thickness in the mid-tibial diaphysis. Data represent mean ± SD. (n = 5 mice) (p-values determined by two-way ANOVA with Tukey’s multiple comparisons test). (E, F) Tile scan confocal images showing Collagen I alpha one chain (Col1a1) staining (green; E) and PDGFRβ staining (green; F) in femoral sections from ovariectomized female mice treated with vehicle or pLIVE-Dll4(E12). Nuclei, DAPI (blue). Graphs show relative ratio (percentage) of Col1a area/DAPI area and PDGFRβ area/DAPI area. Data represent mean ± SD. (n = 5 mice) (p-values determined by two-tailed unpaired t-test (E) with Welch’s correction (F)). (G) Representative μ-CT images of trabecular bone in the distal tibial metaphysis of male, female sham, and ovariectomized mice. Graphs show quantitation of the trabecular bone volume/total volume, trabecular number, and bone surface. Data represent mean ± SD. (n = 5 mice), (p-values determined by one-way ANOVA followed by Sidak’s multiple comparisons test).


