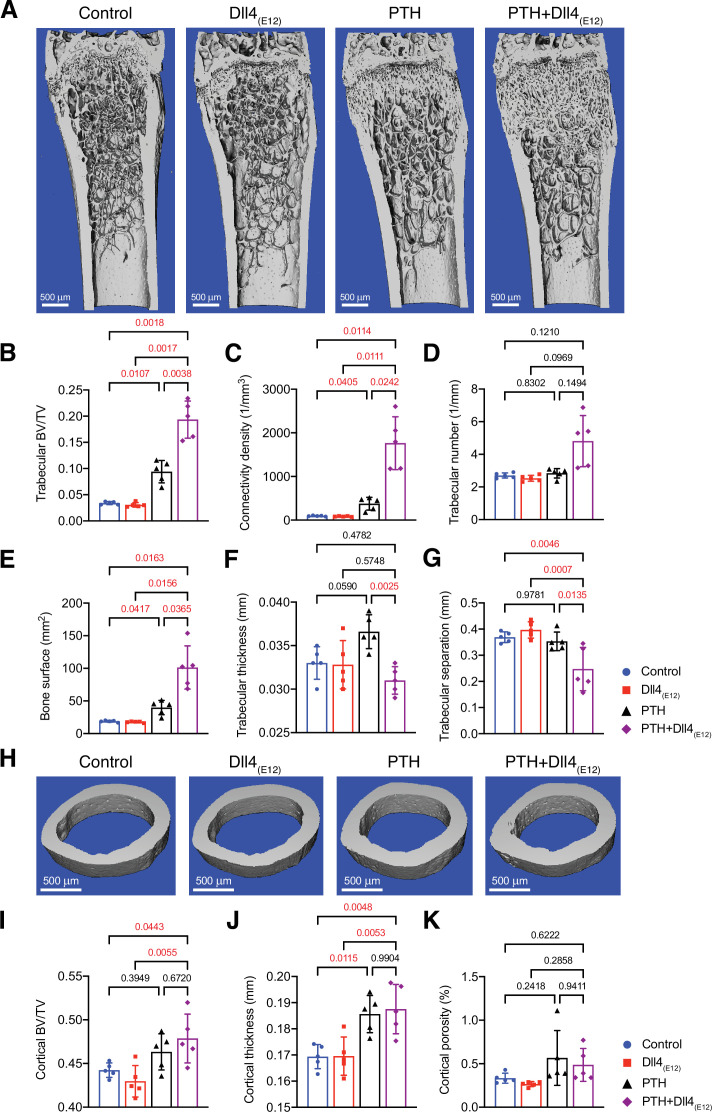
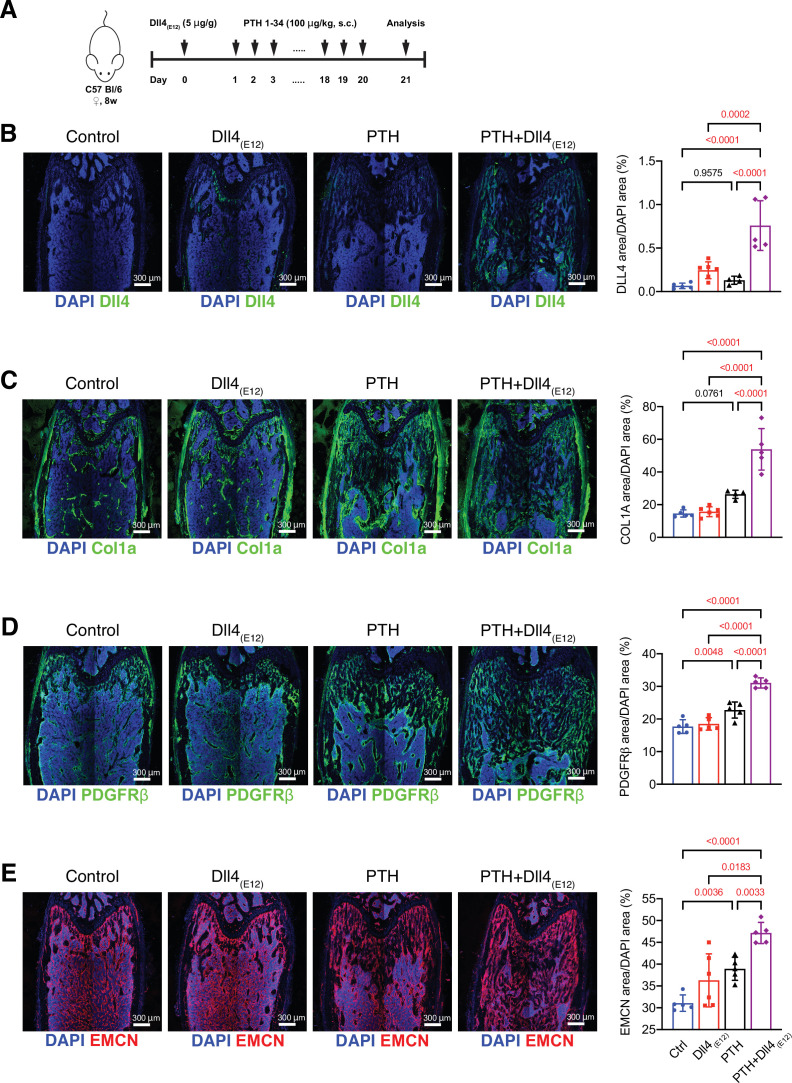
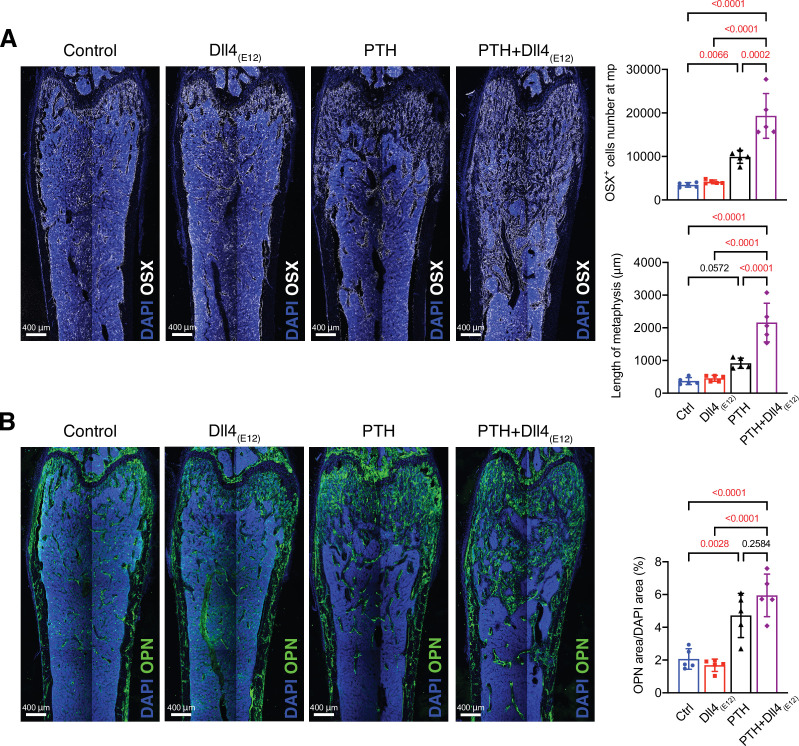
Figure 7. Synergistic action of recombinant Dll4(E12) and parathyroid hormone (PTH).
(A) Representative micro-computed tomography (μ-CT) images of trabecular bone in the distal femoral metaphysis of female wild-type mice treated with vehicle, pLIVE-Dll4(E12), PTH, or the combination of both for 3 weeks. (B–G) Quantitative analysis of μ-CT data on trabecular bone volume/total volume (B), trabecular connectivity density (C), trabecular number (D), bone surface (E), trabecular thickness (F), trabecular separation (G) in the distal femoral metaphysis. Data represent mean ± SD. (n = 5 mice) (p-values determined by one-way ANOVAs (F, G) followed by Sidak’s multiple comparisons test or Brown-Forsythe and Welch’s ANOVAs (B, C, D, E) followed by Dunnett’s T3 multiple comparisons test). (H) Representative μ-CT images of cortical bone in the female midfemoral diaphysis. (I–K) Graphs from μ-CT analysis of the cortical bone volume/total volume (I), cortical thickness (J), and cortical porosity (K) in the midfemoral diaphysis. Data represent mean ± SD. (n = 5 mice) (p-values determined using one-way ANOVAs followed by Sidak’s multiple comparisons test).


