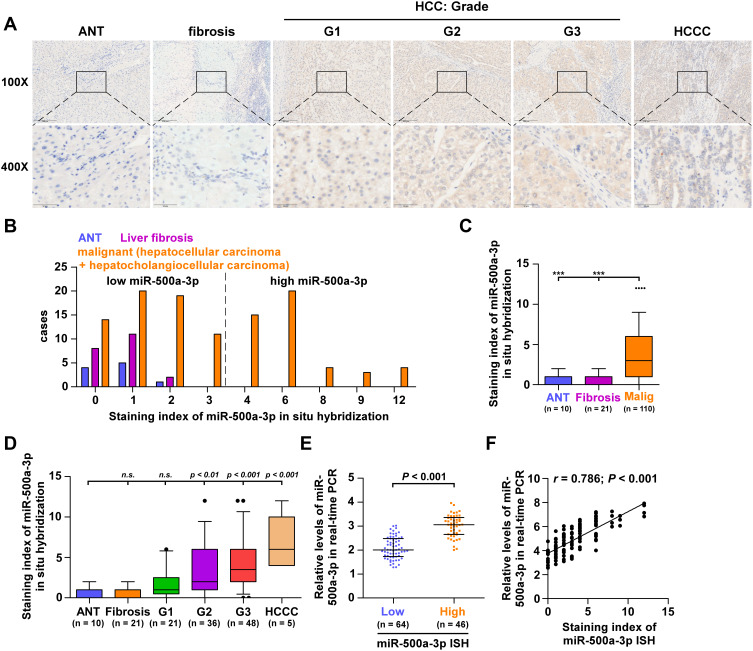
Figure 2.
miR-500a-3p is upregulated in hepatocellular carcinoma. (A) Representative images of low-power (100×, top) and high-power (400×, bottom) fields of miR-500a-3p expression by in situ hybridization (ISH). Scale bars, 200 mm for 100× magnification and 50 mm for 400× magnification. (B) The number of ANT, liver fibrosis tissues and malignant HCC tissues in different staining index groups of ISH. (C) Staining index of miR-500a-3p in 10 ANT, 21 liver fibrosis tissues, and 110 HCC tissues by ISH. “•” indicates HCC tissues with very high miR-500a-3p level above the upper standard deviation of the average miR-500a-3p level in all HCC tissues. ***Indicates P < 0.001. (D) Staining index of miR-500a-3p by ISH in 10 ANT, 21 liver fibrosis tissues, 21 HCC tissues with grade I, 36 HCC tissues with grade II, 48 HCC tissues with grade III and 5 hepatocholangiocellular carcinoma tissues. “••” indicates HCC tissues with very high miR-500a-3p level above the upper standard deviation of the average miR-500a-3p level in all HCC tissues. (E) Real-time PCR analysis of miR-500a-3p in 46 HCC tissues with high ISH scores compared with 64 HCC tissues with low ISH scores. The median ISH score in HCC tissues was used to stratify low and high ISH scores. (F) Correlation of miR-500a-3p expression level with ISH scores with expression levels of miR-500a-3p by real-time PCR in HCC tissues.

