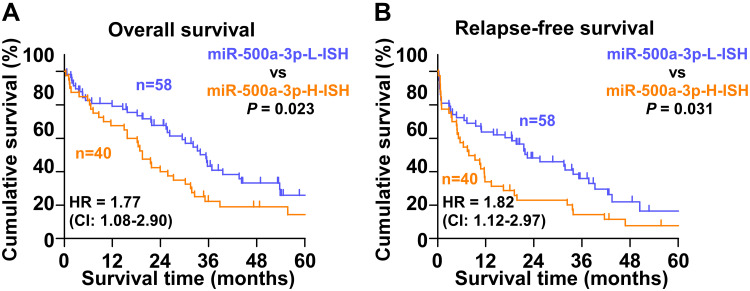
Figure 4.
High levels of miR-500a-3p predict poor prognosis and early recurrence in HCC patients. (A) Kaplan–Meier analysis of overall curves of patients with HCC in high miR-500a-3p ISH (n=40) and low miR-500a-3p ISH (n=58). P < 0.01, Log rank test. The data shown in scatter plot and bar graph were determined by the median with interquartile range and median with standard deviation. (B) Kaplan–Meier analysis of relapse-free curves of patients with HCC in high miR-500a-3p ISH (n=40) and low miR-500a-3p ISH (n=58). P =0.014, Log rank test. The data shown in scatter plot and bar graph were determined by the median with interquartile range and median with standard deviation.

