
FIGURE 6.
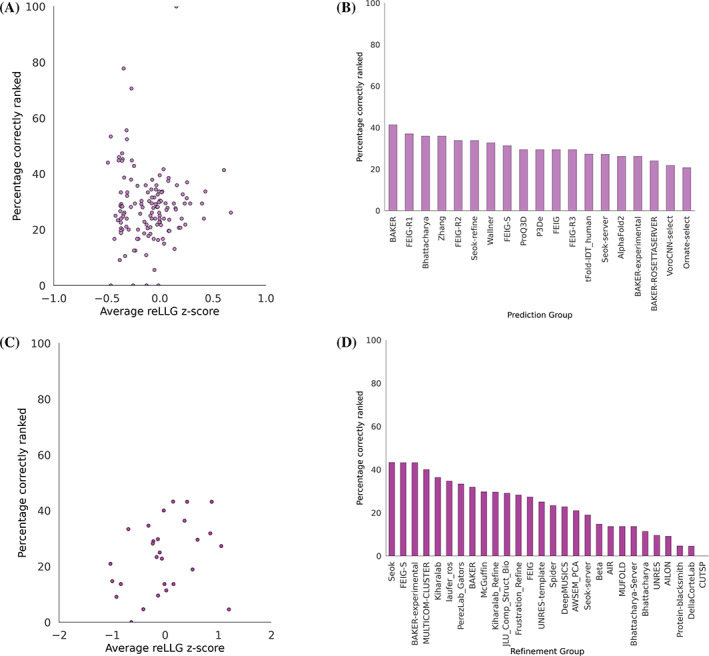
Percentage of targets for each group for which model #1 was the highest scoring in reLLG. Only the targets for which five models were submitted were considered. (A) Scatter plot of percentage correct versus average reLLG Z‐score for the prediction category. All groups are included except AlphaFold2, for which the average reLLG Z‐score is 8.28 and the percentage correctly ranked is 26.1. (B) Bar plot of percentage correctly ranked with the top 20 best groups from the overall prediction category ranking. (C) Scatter plot for the refinement category, as in (A), including all groups. (D) Bar plot, as in (B), with all groups from the refinement category