
FIGURE 8.
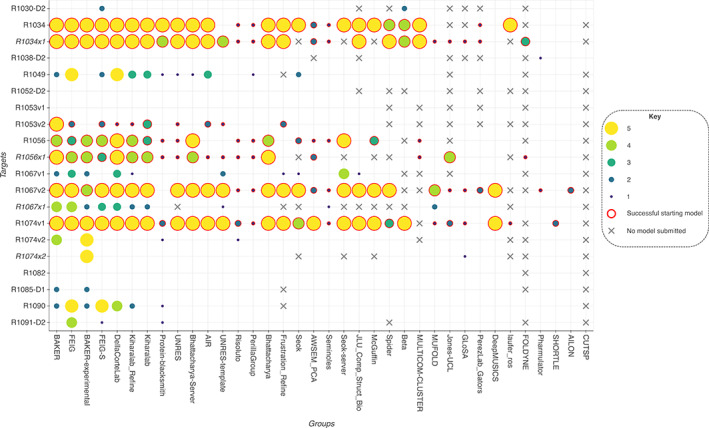
The plot shows the success of the group's refined models in MR for each of the 20 refinement cases where experimental diffraction data were available. Groups are ordered from left to right by the number of cases where they produced at least one successful solution. Refinement cases involving the extended extra 6 weeks of refinement are shown in italics. The three cases where an AlphaFold2 prediction was used as the starting model are R1053v2, R1067v2, and R1074v1. Points are encircled in red where the starting model was also successful in MR