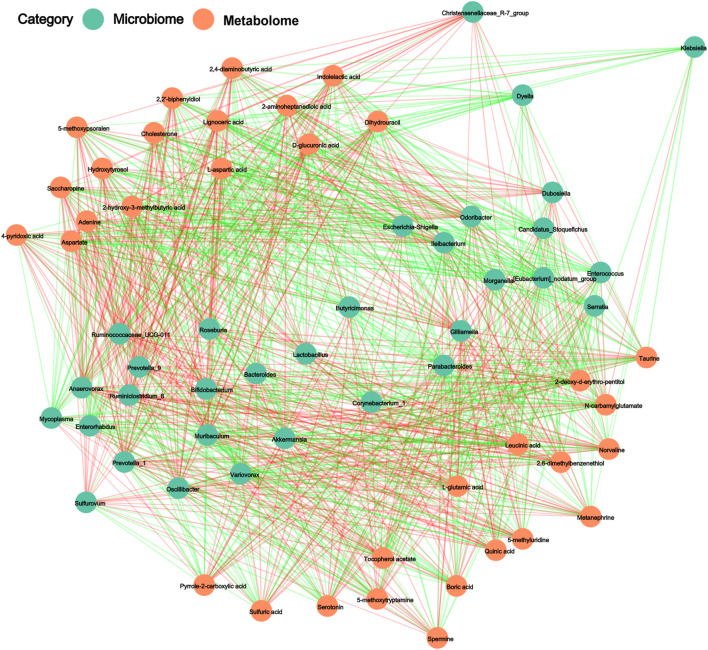
FIGURE 6.
The regulatory networks between 32 gut microbiota (p < 0.01) and 33 faecal metabolites (p < 0.001) in the ND group in comparison with the HSPEN group. The Pearson’s rank correlations (R-value > 0.40) are expressed as red and green lines, representing positive and negative correlations, respectively.

