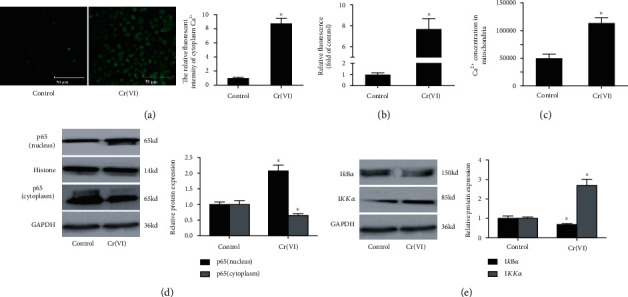
Figure 5.

Cr(VI) caused intracellular Ca2+ overload and NF-κB activation. The L02 hepatocytes were exposed to Cr(VI) for 4 weeks. (a) The mean fluorescence intensity intracellular Ca2+ concentration was determined by light microscopy (the micrograph of the cells, 200x), and ImageJ software was used to analyze the relative fluorescent intensity showed in bar graph; (b) spectrofluorometry was used to detect the change of Ca2+ concentration in cytoplasm. (c) Rhod-2 was used to assay the concentration of Ca2+ in mitochondria. (d) The protein levels of p65 (cytoplasm and nucleus) were determined by Western blot. (e) The expression of IκBα and IKKα was detected by Western blot after Cr(VI) treatment. ImageJ software was used to analyze the relative levels of proteins normalized to the expression of GAPDH. All experiments were repeated at least 3 times and expressed as mean ± SD. ∗p < 0.05, compared with control. For the sake of clarity, the same control GAPDH was applied to compare with all experimentally relevant proteins with the same exposure time detected on the same SDS-PAGE gel unless otherwise stated.
