
Figure 4.
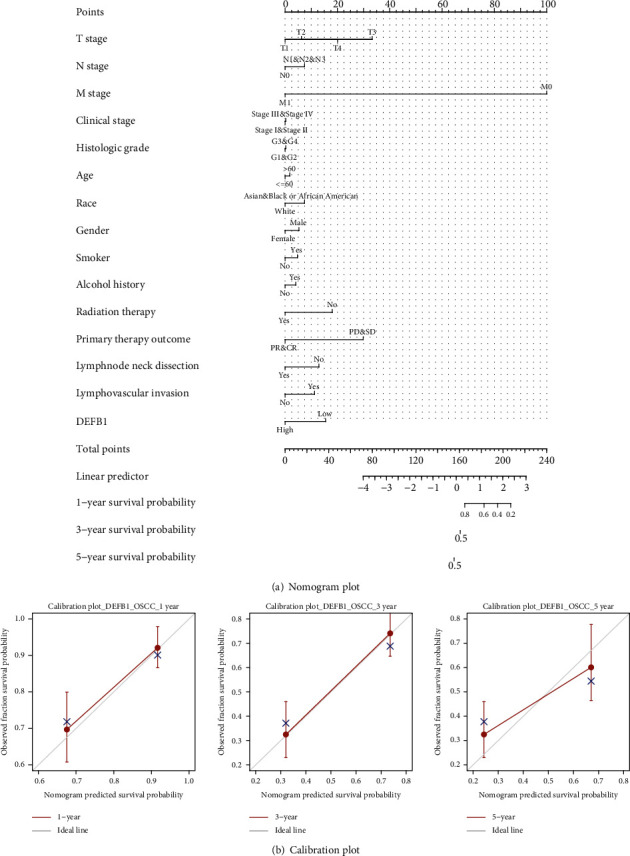
Nomogram plot and calibration plot. (a) Nomogram plot for predicting probability of patients with 1-, 3-, and 5-year overall survival. (b) Calibration curve for nomogram-predicted 1-year, 3-year, and 5-year overall survival. The x-axis is the nomogram-predicted survival probability, and the y-axis is the observed survival probability, respectively.