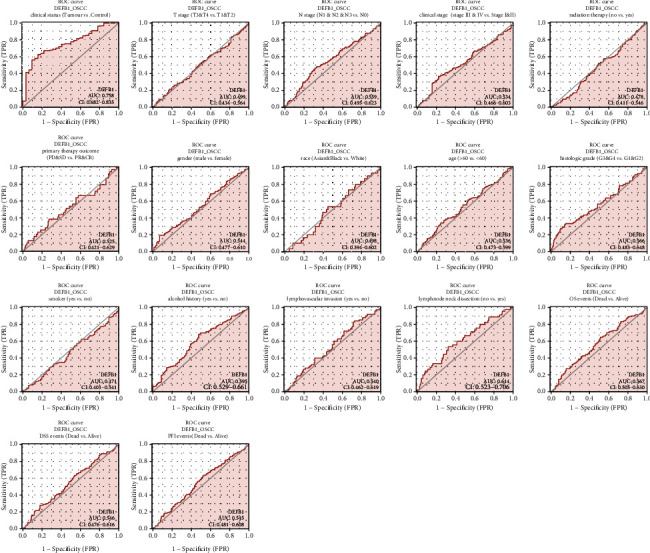
Figure 5.

The ROC curves evaluating the diagnostic values of the DEFB1 gene in predicting a variety of clinicopathologic variables including clinical status (tumor vs. control), T stage (T3 and T4 vs. T1 and T2), N stage (N1 and N2 and N3 vs. N0), clinical stage (Stages III and IV vs. Stages I and II), histologic grade (G3 and G4 vs. G1 and G2), radiation therapy (no vs. yes), primary therapy outcome \n (PD and SD vs. PR and CR), gender (male vs. female), race (Asian and Black vs. White), age (>60 vs. <60), smoker (yes vs. no), alcohol history (yes vs. no), lymphovascular invasion (yes vs. no), lymph node neck dissection (no vs. yes), OS events (dead vs. alive), DSS events (dead vs. alive), and PFI events (dead vs. alive).
