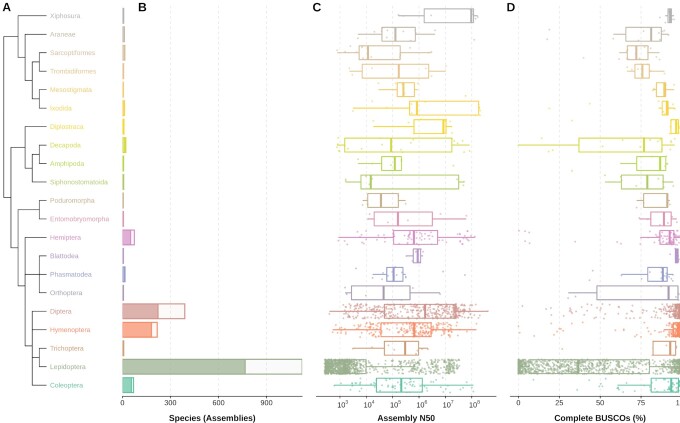
Figure 2:
Order-level representation, contiguity, and completeness of 2,024 available assemblies for 1,326 arthropod species from the 21 orders with ≥5 assemblies. Data are presented only for orders with ≥5 assemblies available at the NCBI (2021–06-11). (A) Phylogenetic relationships of the 21 orders as resolved by the NCBI Taxonomy database. (B) Number of assemblies (entire bars) and unique species (dark fractions) retrieved from the NCBI Assembly database for each order. (C) Distribution of assembly NCBI scaffold N50 values (base pairs, log scale) for each order. (D) Distribution of BUSCO completeness (% of 1,013 BUSCOs) for the arthropod lineage dataset (arthropoda_odb10) for each order. Box plots show the median, first and third quartiles, and lower and upper extremes of the distribution (1.5 × IQR), and all values are overlaid as points to show the full distribution.

