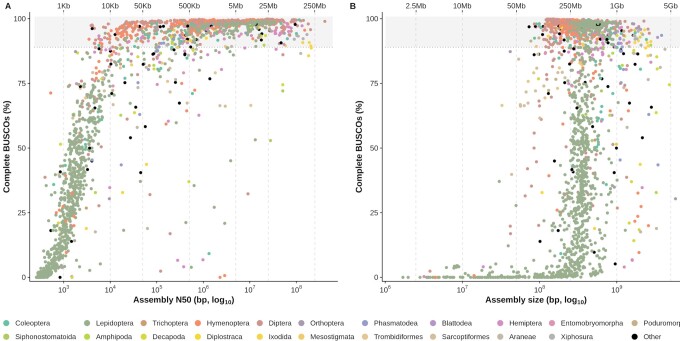
Figure 3:
BUSCO completeness compared with assembly contiguity and size. Complete BUSCOs (in % of total BUSCOs for the arthropoda_odb10 dataset) are plotted against assembly N50 in bp (A) and assembly size in bp (B) for each assessed assembly. Both assembly N50 and assembly size are represented with a log scale. The colour of a point indicates the order of the sequenced species. Dotted lines indicate N50 values of 1, 10, 50, and 500 kb and 5 Mb in A and assembly size values of 50 Mb, 250 Mb, 1 Gb, and 5 Gb in B. BUSCO completeness scores >90% are highlighted with a grey background.

