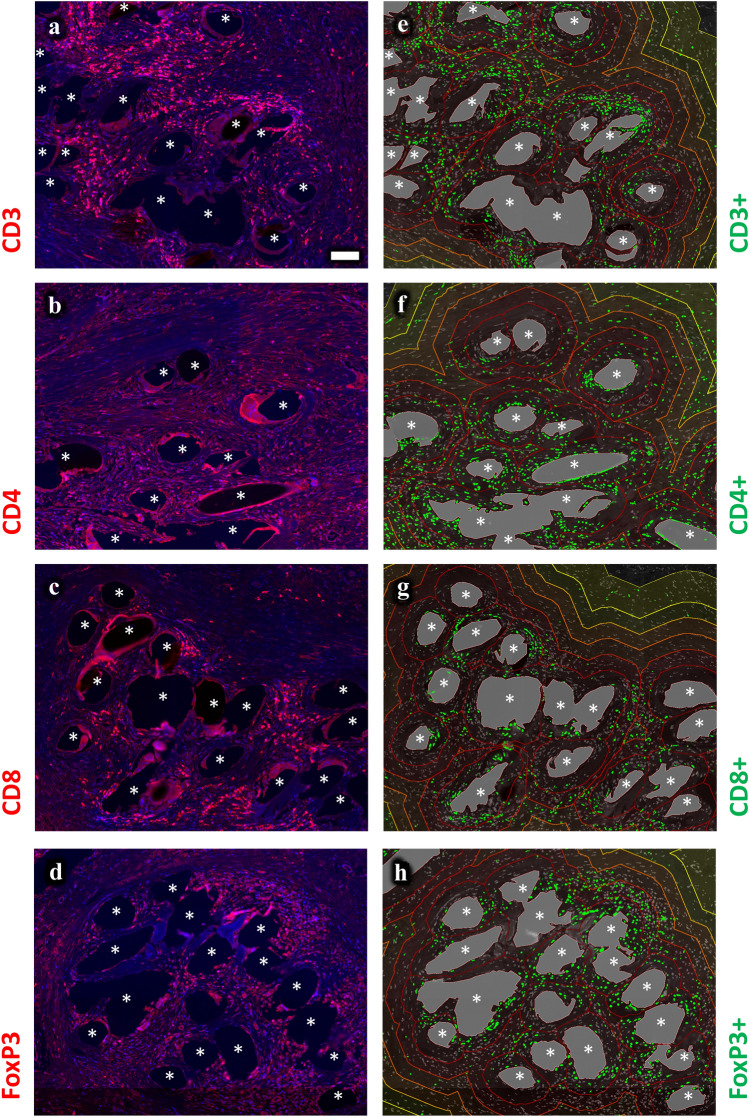
Fig. 5.
Spatial analysis of immunofluorescence labeled immune cells using Euclidean distance maps. Labeling of T cells (CD3), Th (CD4), Tc (CD8), and Tregs (CD8). Nuclei are labeled with DAPI (blue). a–d Labeling of immune cells with Cy5 (red) and e–h backward gating of “positive” cells (green) with superimposed distance map, respectively. The Euclidean distance map consists of six regional zones from 0–50 µm (dark red) to 250–350 µm (bright yellow) in 50 µm steps. Locations of mesh fibers are marked with asterisks, scale bar = 100 µm. Images of the other cell types with distance maps are provided in the supplementary file (s-Fig. 5). Images of explant #7 (color figure online)

