Fig. 1.
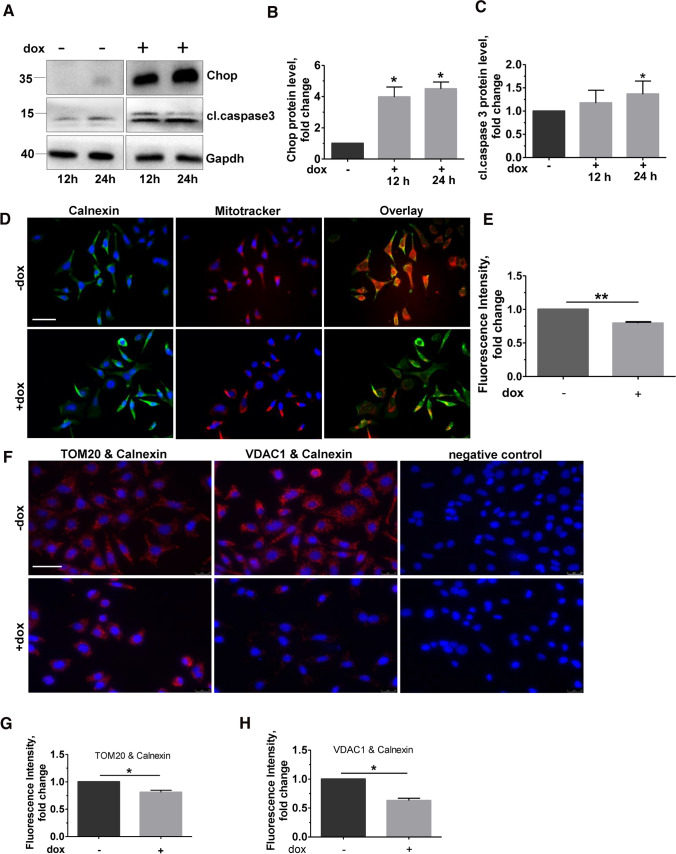
ER–mitochondria tethering is impaired upon Chop overexpression. A MLE12 cells were either not induced or were induced with 1 µg/mL doxycycline for Chop expression for 12 and 24 h, followed by immunoblots for the given proteins from total cell lysates. The positions of molecular weight markers are shown. B and C Quantification of significant increase in cl.caspase 3 protein levels (C) upon Chop induction (B) obtained from (A). Relative protein amounts were normalized to Gapdh and their level in −dox cells was set as one. D Representative immunoflourescence images of MLE12 cells either non-induced or induced with dox for 24 h for Chop expression. Staining for ER (calnexin, green) and mitochondria (MitoTracker red) is shown. Nuclei were stained with DAPI (blue), scale bar = 60 µm. E Fluorescence intensity of co-localization was quantified using ImageJ, and its intensity in −dox cells was set to one. F Proximity ligation assay with antibodies against calnexin and TOM20 or calnexin and VDAC1, followed by fluorescence microscopy images are shown; scale bar = 60 µm. G and H Fluorescence intensity was quantified using ImageJ, and its intensity in uninduced cells was set to one. Blots, stainings and analysis were performed from n = 3 and at least three technical replicates. Statistical significance is indicated as: *p ≤ 0.05, **p ≤ 0.01

