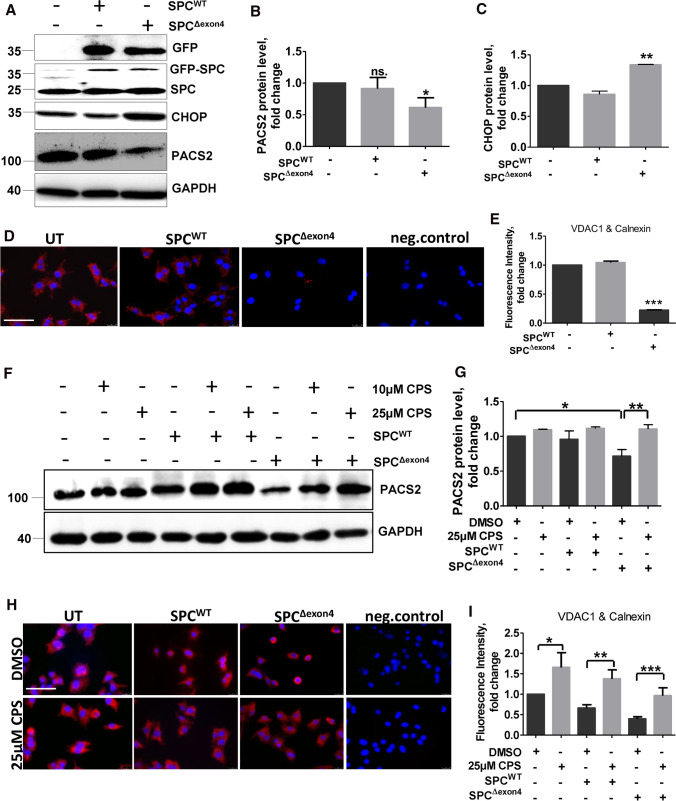
Fig. 5.
Modulating PACS2–TRPV1 axis with CPS rescues ER–mitochondrial tethering and PACS2 protein in cells overexpressing SPCΔexon4. A MEL188 cells were stably transfected with either SPCWT or SPCΔexon4 plasmids or left un-transfected, followed by immunoblots for the given proteins. B and C Quantification of PACS2 (B) and CHOP (C) protein levels are shown. Relative protein amounts were normalized to GAPDH and their mean value in untransfected cells was set as one. D Representative fluorescence microscopy images following proximity ligation assay with antibodies against calnexin and VDAC1 in SPCWT or SPCΔexon4 overexpressing cells, scale bar = 60 µm. E Fluorescence intensity was quantified using ImageJ, and its intensity in untransfected cells was set to one. F Cells stably expressing SPCWTor SPCΔexon4 or control cells were treated with DMSO or CPS, followed by immunoblotting of PACS2 and GAPDH. G Quantification of PACS2 protein expression is shown. Relative protein amounts were normalized to GAPDH and its mean value in control cells was set as one. H Fluorescence microscopy images following proximity ligation assay with antibodies against calnexin and VDAC1 in control cells or in cells overexpressing SPCWT or SPCΔexon4, followed by DMSO or CPS treatments at the indicated doses, scale bar = 60 µm. I Fluorescence intensity was quantified using ImageJ, and its intensity in untreated control cells was set as one. ‘n’ of three independent experiments were performed and statistical significance is indicated as: *p ≤ 0.05, **p ≤ 0.01, ***p ≤ 0.001

