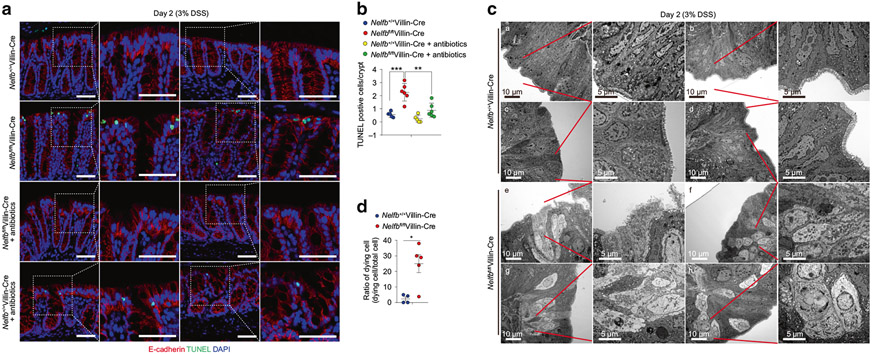
Fig. 2. Epithelial NELF represses microbiota-dependent cell death in IECs before the onset of colitis.
Nelfb+/+Villin-Cre and Nelfbfl/flVillin-Cre mice were pre-treated with water or antibiotics, and continued drink with 3% DSS for 2 days. a, b TUNEL analysis (a) and quantification (b) of cell death in Nelfb+/+Villin-Cre and Nelfbfl/flVillin-Cre mice after DSS or DSS with antibiotics treatment (n = 4–6). Scale bars, 50 μm. c, d TEM analysis (c) and quantification (d) of IEC cell death in Nelfb+/+Villin-Cre (a–d) and Nelfbfl/flVillin-Cre (e–h) mice after DSS treatment (n = 4–5). Scale bars, 5 or 10 μm. Data are pooled from at least 2 (B and D) independent experiments and shown as mean ± SEM. Student’s t-test was performed; *p ≤ 0.05, **p ≤ 0.01, ***p ≤ 0.001, ****p ≤ 0.0001. Images (a, c) represent at least two independent experiments.

