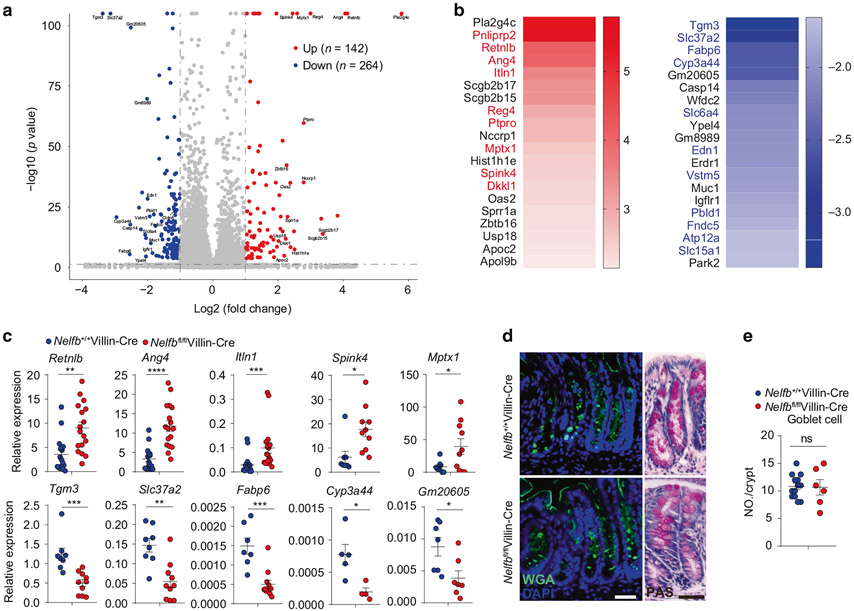
Fig. 4. Epithelial NELF deficiency leads to dysregulation of IEC gene expression without affecting cell differentiation.
a The volcano plot analysis of RNA-seq dataset showing the top upregulated and downregulated genes in colonic epithelia cell from Nelfbfl/flVillin-Cre mice versus Nelfb+/+Villin-Cre at stead state. b Heat map analysis of RNA-seq dataset showing the top 20 upregulated and downregulated genes in colonic epithelia cell from Nelfbfl/flVillin-Cre mice versus Nelfb+/+Villin-Cre. Red font indicates that upregulated genes are highly expressed in goblet cells and blue font indicates that downregulated genes are highly expressed in enterocytes. c qPCR analysis of the expression of representatively upregulated and downregulated genes from RNA-seq dataset in Nelfb+/+Villin-Cre and Nelfbfl/flVillin-Cre mice (n = 5–17). d, e Immunofluorescent WGA and PAS staining (d) and quantification (e) analysis of the goblet cell in Nelfb+/+Villin-Cre and Nelfbfl/flVillin-Cre (n = 6–13). Scale bars, 50 μm. Data are pooled from at least two (c, e) independent experiments and shown as mean ± SEM. Student’s t-test was performed; *p ≤ 0.05, **p ≤ 0.01, ***p ≤ 0.001, ****p ≤ 0.0001; ns not significant (p > 0.05). Images (d) represent at least two independent experiments.

