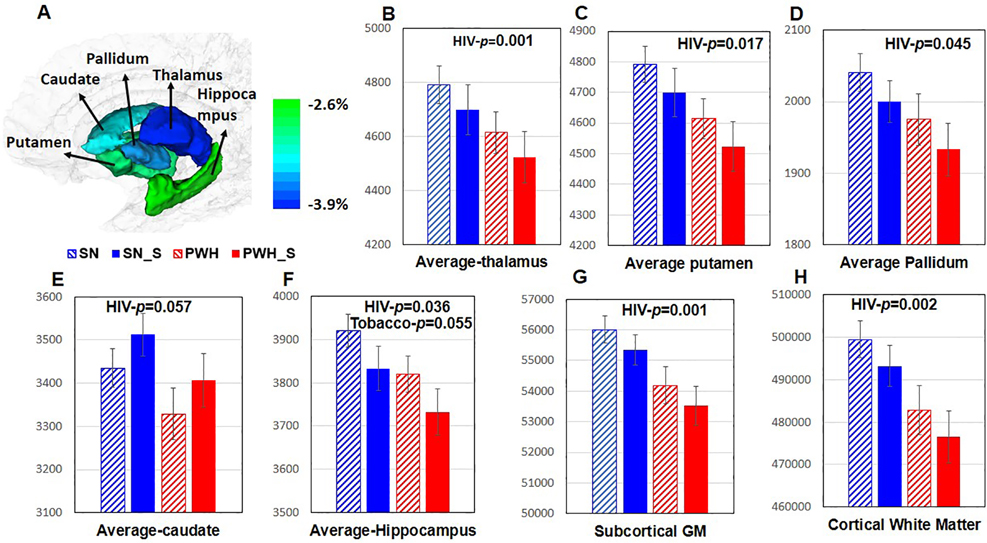
Figure 2. Volume of Whole Brain and Subcortical Regions in the Four Participant Groups.
A ROIs on a standard brain template. Color bar indicates the % of volume difference between PWH and SN participants. B-D Regardless of smoking status, PWH participants had smaller thalamus (−3.9%, p=0.001), putamen (−3.7% p=0.017) and pallidum (−3.3%, p=0.045) than SN participants. E Caudate tended to be smaller in PWH compared to SN participants (−3.1%, p=0.057). F Regardless of smoking status, PWH participants had smaller hippocampus (−2.5%, p=0.036) than SN participants. Regardless of HIV serostatus, tobacco smokers tended to have smaller hippocampi than nonsmokers (−2.87%, p=0.055). G-H Regardless of tobacco smoking status, PWH participants had smaller total subcortical gray matter (−3.0%, p=0.001) and cortical white matter (−2.7%, p=0.002) than SN individuals. PWH=people with HIV disease and are non-smokers, SN= HIV seronegative non-smokers, SN_S=HIV seronegative tobacco smokers, PWH_S=PWH tobacco smokers, GM=gray matter.

