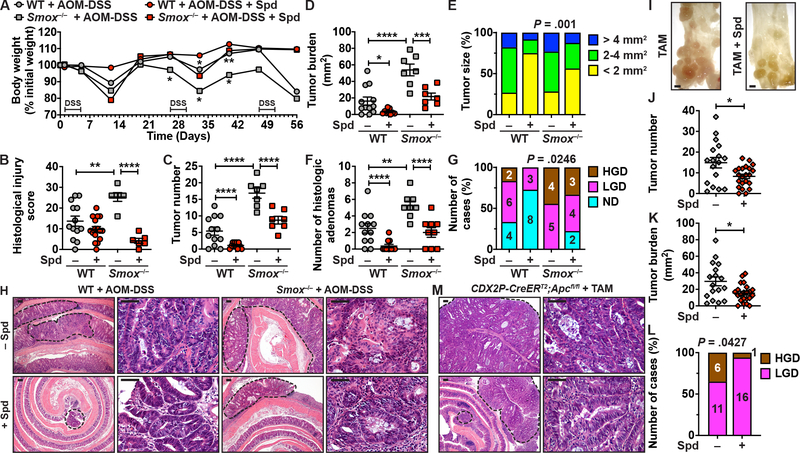
Figure 3.
Effect of Spd treatment on colon carcinogenesis. (A-H) WT and Smox–/– mice were treated with AOM-DSS and were given Spd throughout the experiments. Body weights were measured weekly and are depicted as percentage of initial body weight (A). *P < .05 and **P < .01 compared to mice from the same genotype not treated with Spd. After 56 days, colons were removed and histological injury score (B), tumor number (C), tumor burden (D), tumor size (E), number of histologic adenomas (F), and frequency of LGD and HGD (G) were determined; ND, no dysplasia. Panel H depicts representative images of H&E staining. Tumors are surrounded by dotted lines. High-power photomicrographs show HGD in WT and Smox–/– mice treated with AOM-DSS and LGD in those animals that were given Spd. The scale bars on the low-power and high-power photomicrographs correspond to 100 and 50 μm, respectively. (I-M) CDX2P-CreERT2;Apcfl/fl mice were treated with TAM and were given Spd or not. After 39 days, tumor number (I-J) and tumor burden (K) were determined in the mid and distal colon; scale bar in I, 1 mm. The frequency of LGD and HGD was determined by histologic assessment (L). Panel M shows representative images of H&E staining of the colon of TAM-treated animals. For all the panels with symbols, *P < .05, **P < .01, ***P < .001, ****P < .0001 by two-way ANOVA and Tukey test (A-D and F) or Student’s t test (J, K). We also used Chi-Square (E and G) and Fisher’s exact test (L).

