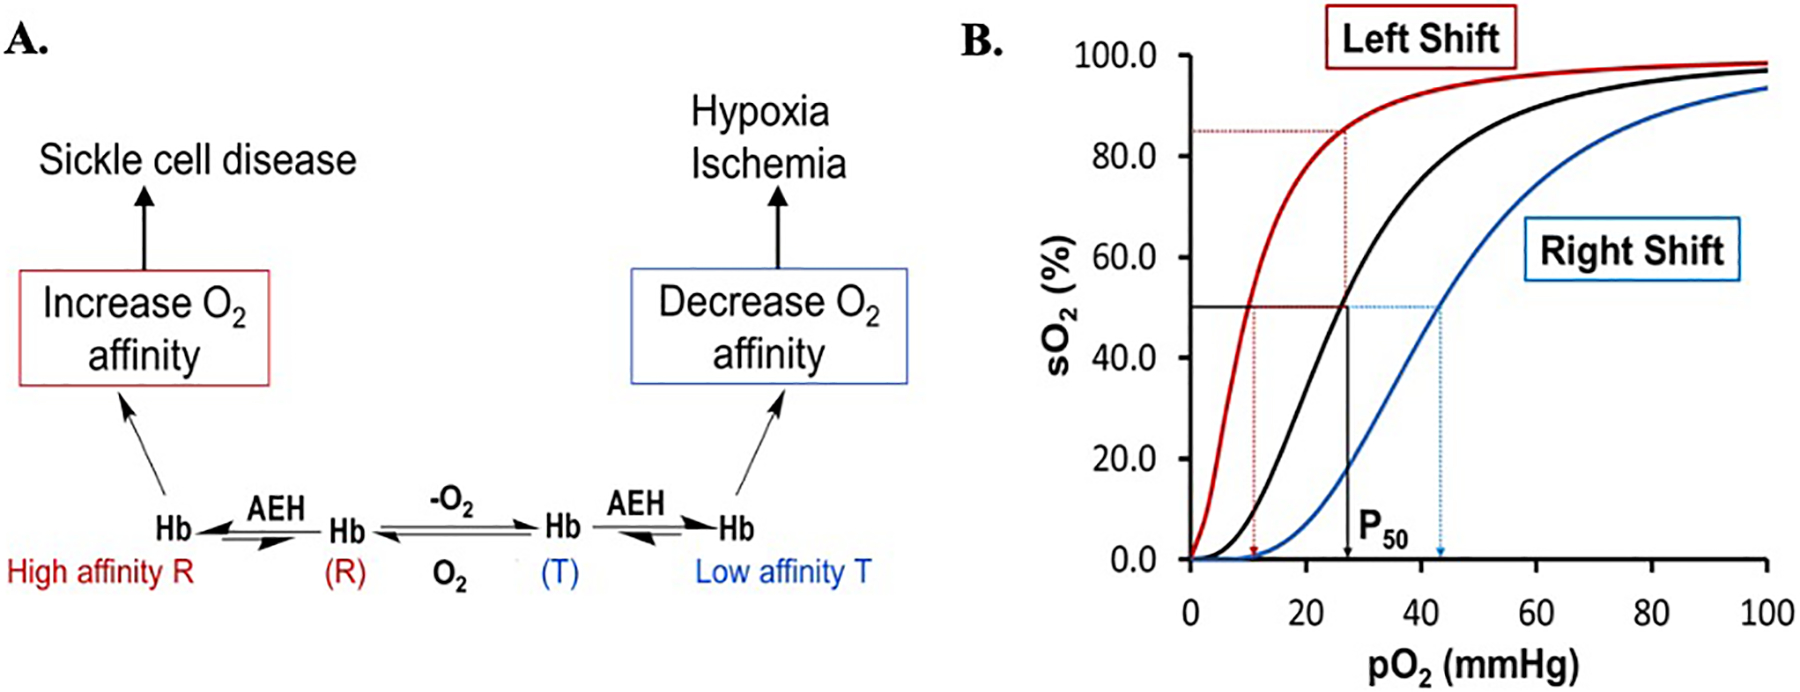
Figure 3.

A) Modulation of Hb allosteric activity with synthetic allosteric effectors of Hb (AEHs) and, B) Oxygen equilibrium curve (OEC) of Hb showing P50 (the partial pressure at which 50% of Hb is saturated with oxygen) in black curve. Increasing Hb oxygen affinity with AEH shifts the OEC to the left (red curve) while decreasing it shifts the curve to the right (cyan curve).
