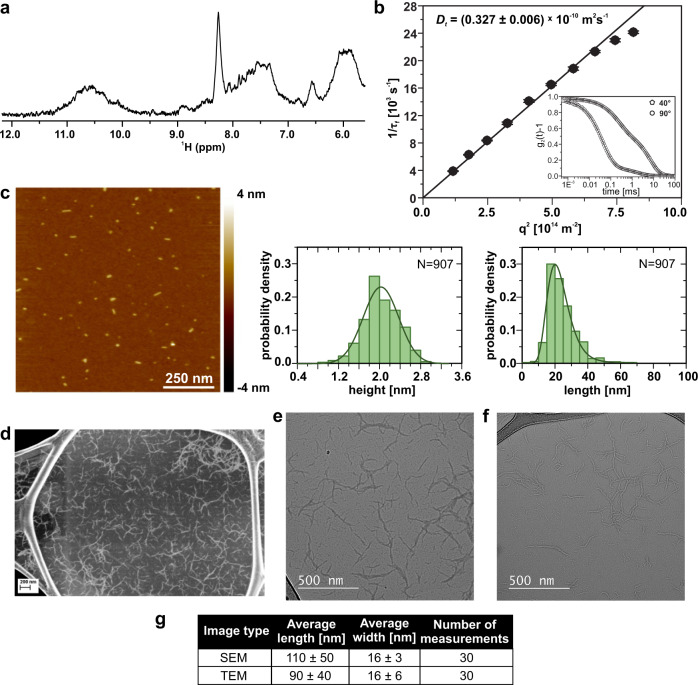
Fig. 1. G-wires formed by d(G2AG4AG2).
a Selected region of 1D 1H NMR spectrum shows broad signals, typical for G-wires. b DLS data. Insert shows experimental autocorrelation curves. c Representative AFM height image of G-wires with corresponding length and height histograms. AFM image was obtained at very low oligonucleotide concentration (0.2 µM) enabling detection of individual wires, with mean height of 2.0 ± 0.1 nm and mean length of 22.1 ± 0.4 nm. Statistics collected over eight images. d SEM images and conventional TEM images of unstained G-wires taken at substantial e under-focus and f over-focus. We observe random distribution of G-wires on GO support. Smaller G-wires are more clearly visible in TEM images. g Table of estimated average length and width of G-wires from SEM and TEM images. Sample was assembled via method 1 (see “Methods” section).

