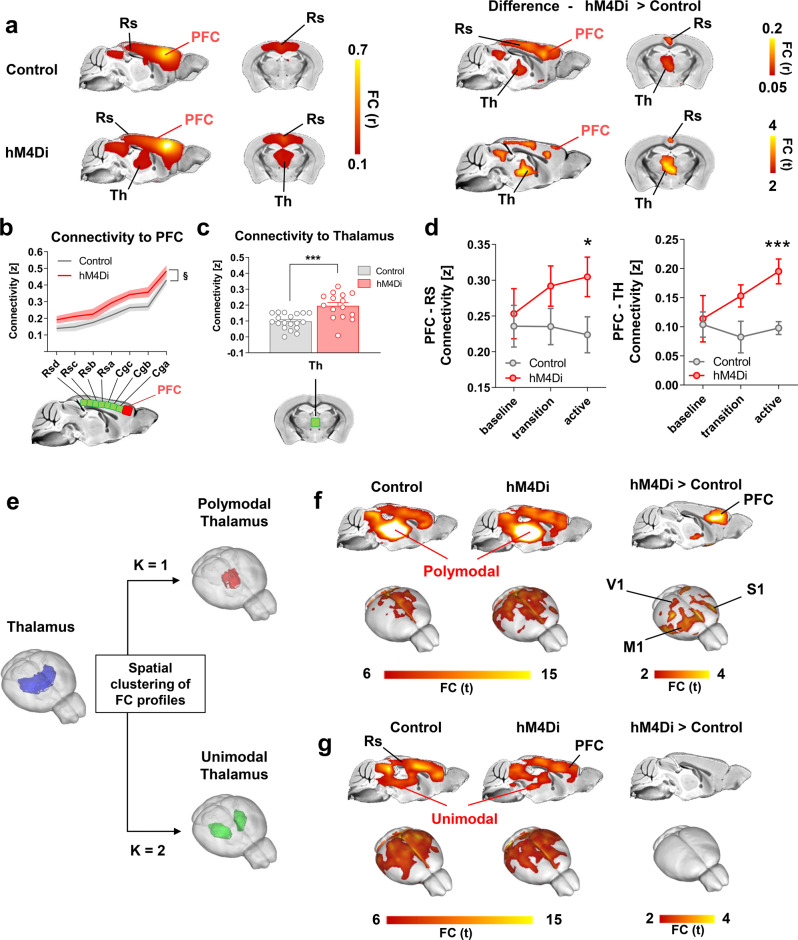
Fig. 3. Chemogenetic inhibition of the mouse PFC results in rsfMRI overconnectivity.
a Seed-based connectivity of the PFC and between group difference map revealed rsfMRI over-connectivity in the DMN of hM4Di expressing mice during the active phase. b Antero-posterior profiling of rsfMRI connectivity of the PFC along the midline axis of the mouse DMN in the two cohorts (§p = 0.106, two-way ANOVA repeated measurements, genotype effect, n = 15 and n = 19 control or hM4Di-expressing animals, respectively). c Thalamo-cortical rsfMRI hyper synchronization in hM4Di expressing mice and d prefrontal-retrosplenial and prefrontal-thalamic connectivity timecourse (*p = 0.039, ***p < 0.001, two-sided t test, n = 15 and n = 19 hM4Di or GFP-expressing mice, respectively.) Data in b–d are presented as mean values ±SEM. e k-means clustering of PFC-thalamic rsfMRI connectivity profiles (thalamus, blue; polymodal thalamus, red; unimodal thalamus, green) in Control (n = 19) and hM4Di (n = 15) animals. f, g Seed connectivity of sub-thalamic partitions (f polymodal thalamus; g unimodal thalamus) and corresponding between group difference maps. FC functional connectivity, Cg cingulate cortex, M1 motor cortex, S1 sensory cortex, PFC prefrontal cortex, Rs retrosplenial cortex, Th thalamus, V1 visual cortex. Source data are provided as a Source Data file.

