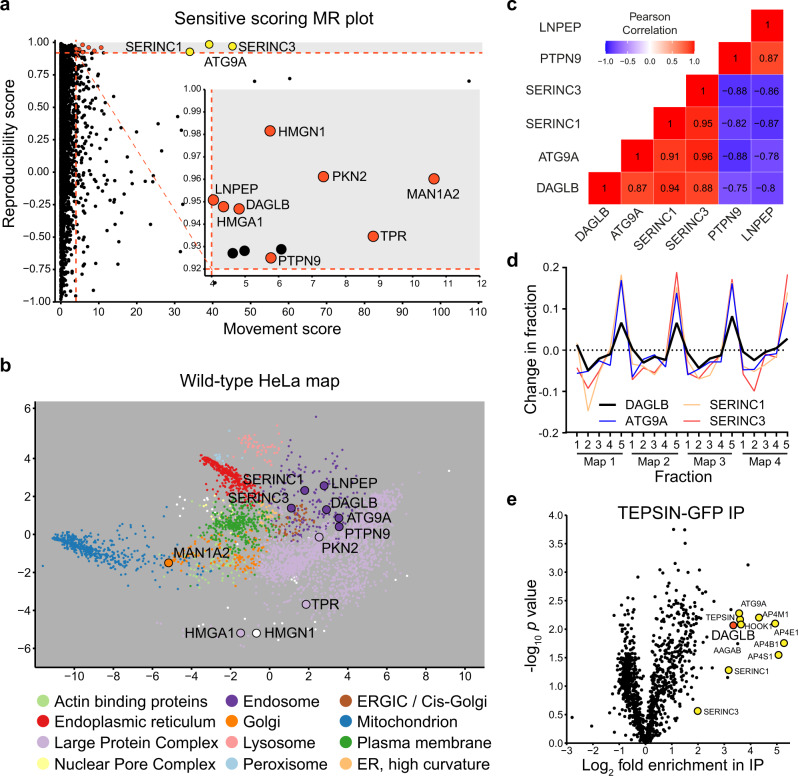
Fig. 1. Sensitive analysis of Dynamic Organellar Maps identifies DAGLB as an AP-4 cargo protein.
a Dynamic Organellar Maps of AP4B1 knockout (KO) and AP4E1 KO HeLa cells were compared to maps of wild-type HeLa cells (each in duplicate, totalling four comparisons). Sensitive statistical scoring was used to detect proteins with a significantly altered distribution in the AP-4 KO cells that were not detected in a previous stringent analysis2 (see Methods for details). For 3926 proteins profiled across all maps, the ‘MR’ plot displays the median magnitude of shift (M) and the mean within-clone reproducibility of shift direction (R). The known AP-4 cargo proteins, ATG9A, SERINC1 and SERINC3 (marked in yellow), were identified with high M and R scores, as expected. The inset plot displays 8 additional hits (marked in red) whose subcellular localisation was significantly and reproducibly shifted in the AP-4 KO lines, with a false discovery rate of ~25%. Proteins that passed the M and R cut-offs but had poor across-clone reproducibility were not considered as hits (marked in black). b The hits from (a) are highlighted on a principal component analysis (PCA)-based visualisation of a deep Dynamic Organellar Map of wild-type HeLa cells19 (combined data from six replicate maps [http://mapofthecell.biochem.mpg.de/]. Each scatter point represents a protein and proximity indicates similar fractionation profiles. Colours indicate subcellular compartment assignment by support vector machine-based classification (white indicates compartment unassigned). Three hits, DAGLB, PTPN9 and LNPEP, map to the endosomal cluster (dark purple), like known AP-4 cargo proteins. c Heat map showing pairwise Pearson correlations between the shift profiles (abundance distribution profiles from knockout maps subtracted from the profiles from control maps) of DAGLB, ATG9A, SERINC1, SERINC3, PTPN9 and LNPEP. d The shift profiles of DAGLB, ATG9A, SERINC1 and SERINC3 are highly correlated, making DAGLB a strong new candidate AP-4 vesicle protein. Maps 1 and 2 are AP4B1 KO maps subtracted from wild-type maps; Maps 3 and 4 are AP4E1 KO maps subtracted from wild-type maps. Fraction numbers 1-5 refer to increasing centrifugation speeds. e High-sensitivity low-detergent immunoprecipitations (IP) from HeLa cells stably expressing the AP-4 associated protein TEPSIN-GFP were analysed by SILAC-based quantitative mass spectrometry2. Data were analysed in comparison to mock immunoprecipitations from wild-type HeLa cells with a two-tailed one sample ratio t test against 0 (each in triplicate, n = 3). DAGLB (marked in red) was highly enriched along with known AP-4 vesicle proteins (marked in yellow). Source data are provided as a Source Data file.

