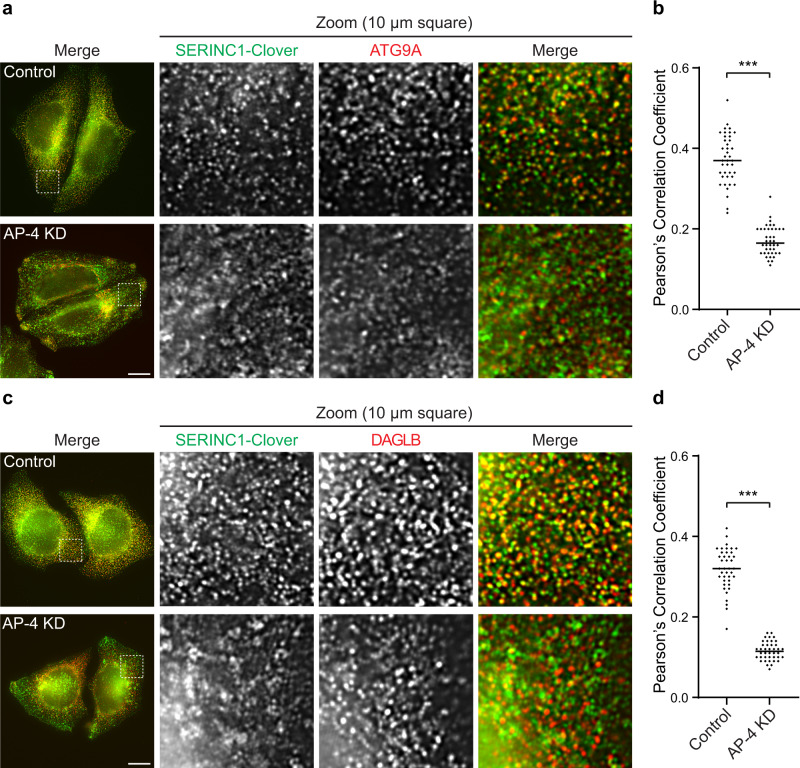
Fig. 5. DAGLB and ATG9A colocalise with SERINC1 in an AP-4-dependent manner.
HeLa cells tagged endogenously with Clover (modified GFP) at the C-terminus of SERINC1 were transfected with siRNA to knock down (KD) AP-4, or were transfected with a non-targeting siRNA (Control). a Super-resolution structured illumination microscopy (SR-SIM) was used to image SERINC1-Clover (via anti-GFP; green) and anti-ATG9A (red). Representative images show the whole field of view and a zoomed image of a peripheral 10 × 10 μm2 square. ATG9A and SERINC1 colocalised in small puncta throughout the cytoplasm in control cells, but not in AP-4 depleted cells. Scale bar: 10 μm. b Quantification of colocalisation between SERINC1-Clover and ATG9A in control and AP-4 knockdown (KD) cells, using Pearson’s Correlation Coefficient (PCC). The experiment was performed in biological duplicate and the graph shows combined replicate data: each datapoint indicates the PCC for an individual cell (horizontal bar indicates median; n = 40 cells per condition, examined across 2 independent experiments). Data were subjected to a two-tailed Mann–Whitney U-test: ***p ≤ 0.001 (p = 9.3 × 10⁻²³). c SR-SIM was used to image SERINC1-Clover (via anti-GFP; green) and anti-DAGLB (red), as in (a). Like ATG9A, DAGLB colocalised with SERINC1 in small puncta throughout the cytoplasm in control cells, but not in AP-4 depleted cells. Scale bar: 10 μm. d Quantification of colocalisation between SERINC1-Clover and DAGLB in control and AP-4 KD cells, using PCC. The experiment was performed in biological duplicate and the graph shows combined replicate data: each datapoint indicates the PCC for an individual cell (horizontal bar indicates median; n = 40 cells per condition, examined across 2 independent experiments). Data were subjected to a two-tailed Mann–Whitney U-test: ***p ≤ 0.001 (p = 1.9 × 10⁻²³). Source data are provided as a Source Data file.

